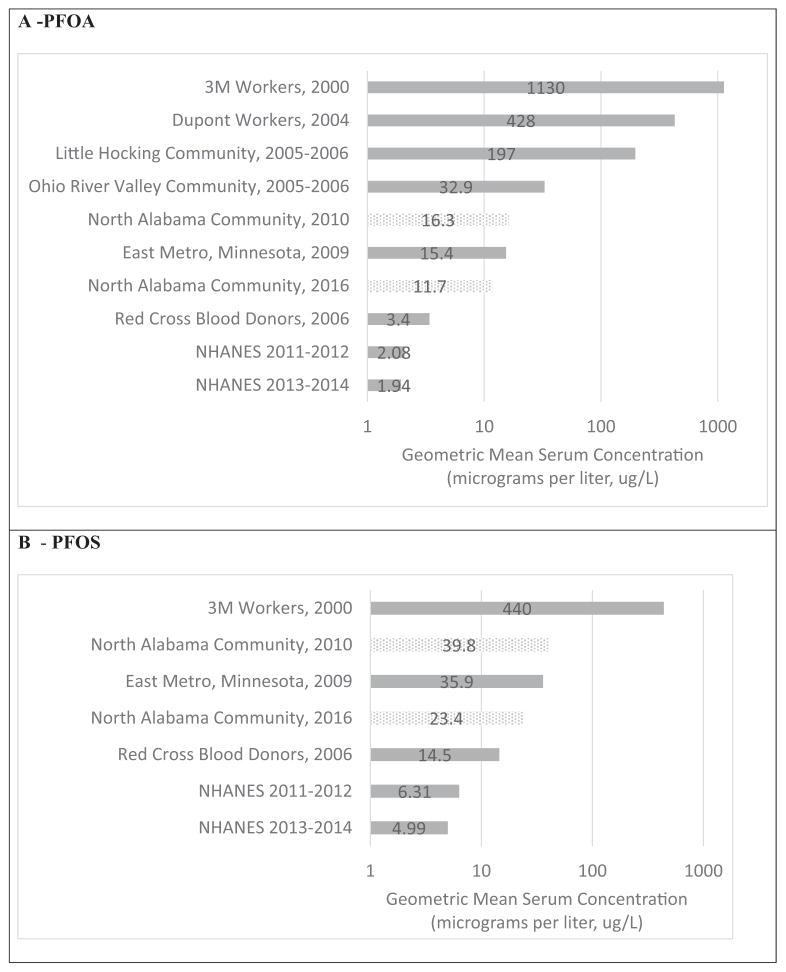
Fig. 1.
Comparison of Mean PFAS Serum Concentrations in a National Reference Population and Occupational and Community Biomonitoring Studies. Mean PFOA (a) and PFOS (b) serum concentrations measured in the 2010 and 2016 investigations compared to national reference populations, and occupational and community biomonitoring studies. References: 3M Workers (Olsen et al., 2003); Dupont (Sakr et al., 2007); Little Hocking, OH (Emmett et al., 2006); Ohio River Valley (Steenland et al., 2009); Minnesota Pilot Study – Minnesota Department of Health 2009; Red Cross Blood Donors (Olsen et al., 2008); NHANES (CDC, 2017).

