Fig. 5.

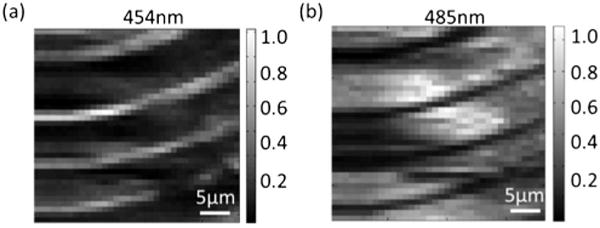
SHG images of BaTiO3 crystal domain at (a) 454 and (b) 485 nm. Images are 36 by 36 pixels with each pixel separated by 1.7 μm. The SHG signals were integrated over the respective spectra with the background subtracted.

SHG images of BaTiO3 crystal domain at (a) 454 and (b) 485 nm. Images are 36 by 36 pixels with each pixel separated by 1.7 μm. The SHG signals were integrated over the respective spectra with the background subtracted.