
Figure 1.
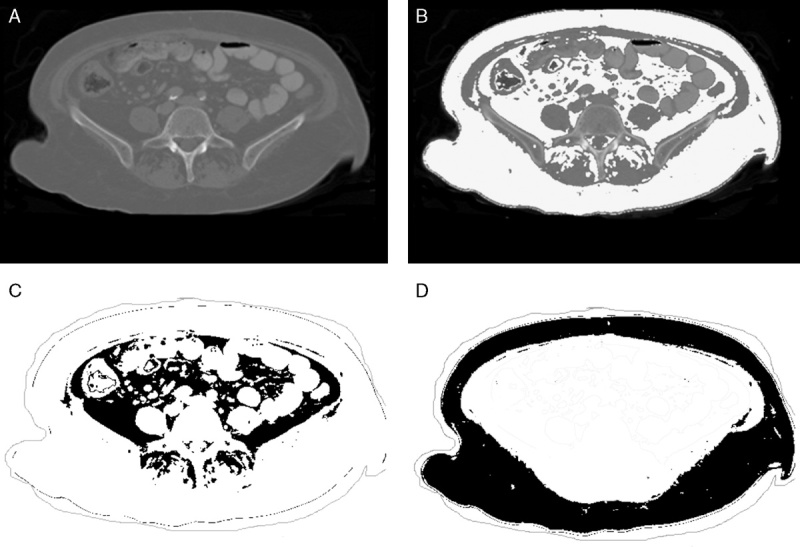
A, Original DICOM image. B, The white highlighted area represents visceral and subcutaneous fat set to a threshold value of −30 to −190 HU. C, The black highlighted area represent visceral fat. D, The black highlighted area represents subcutaneous fat, respectively.