Abstract
Tumor necrosis factor‐related apoptosis‐inducing ligand (TRAIL) and its cognate receptor(s) are up‐regulated in human and murine nonalcoholic steatohepatitis (NASH); however, the consequence of this enhanced expression on NASH pathogenesis remains unclear. TRAIL may either accentuate liver injury by promoting hepatic steatosis and inflammation or it may mitigate the disease process by improving systemic insulin resistance and averting hepatic fibrosis. Herein, we investigated the role of TRAIL in an obesity‐induced murine model of NASH. C57BL/6 wild‐type mice and Trail –/– mice were placed on a 20‐week standard chow or a high‐fat, high‐fructose, and high‐cholesterol (FFC) diet, which induces obesity, insulin resistance, and NASH. Metabolic phenotype, liver injury, inflammation and fibrosis, and adipose tissue homeostasis were examined. FFC diet‐fed Trail –/– mice displayed no difference in weight gain and metabolic profile when compared to wild‐type mice on the same diet. All FFC‐fed mice developed significant hepatic steatosis, which was attenuated in Trail –/– mice. TRAIL deficiency also significantly decreased FFC diet‐induced liver injury as manifested by reduced serum alanine aminotransferase values, hepatic terminal deoxynucleotidyl transferase‐mediated deoxyuridine triphosphate nick‐end labeling‐positive cells, and macrophage‐associated inflammation. FFC diet‐associated hepatic stellate cell activation and hepatic collagen deposition were also abrogated in Trail –/– mice. In contrast to the liver, TRAIL deletion did not improve FFC diet‐induced adipose tissue injury and inflammation and actually aggravated insulin resistance. Conclusion: NASH pathogenesis may be dissociated from other features of the metabolic syndrome, and liver‐targeted inhibition of TRAIL signaling may be salutary. (Hepatology Communications 2017;1:648–662)
Abbreviations
- α‐SMA
alpha smooth muscle actin
- ALT
alanine aminotransferase
- CD
cluster of differentiation
- eWAT
epididymal white adipose tissue
- FADD
Fas‐associated protein with death domain
- FFC
high fat, high fructose and high cholesterol
- IL
interleukin
- mRNA
messenger RNA
- NAFLD
nonalcoholic fatty liver disease
- NASH
nonalcoholic steatohepatitis
- PLA
proximity ligation assay
- SHG
second harmonic generation
- TNF
tumor necrosis factor
- TRAIL
tumor necrosis factor‐related apoptosis‐inducing ligand
- TRAIL‐R
TRAIL receptor
- TUNEL
terminal deoxynucleotidyl transferase‐mediated deoxyuridine triphosphate nick‐end labeling
- WT
wild‐type
Introduction
Nonalcoholic fatty liver disease (NAFLD) is a common disorder characterized by excessive fat accumulation (steatosis) in the liver due to causes other than excessive alcohol use. NAFLD is often the hepatic manifestation of metabolic syndrome, with obesity‐related insulin resistance as the main pathogenic mechanism.1 Accompanying the global obesity epidemic, NAFLD affects an estimated 25% of the world's population.2 A subgroup of patients with NAFLD develop a more severe form of the disease, termed nonalcoholic steatohepatitis (NASH), which may progress to cirrhosis and its sequelae of end‐stage liver disease.
The pathologic hallmarks of NASH are excessive hepatocyte apoptosis and macrophage‐associated liver inflammation. The presence of cell death and inflammation is consistent with death receptor signaling.3 Indeed, tumor necrosis factor (TNF)‐related apoptosis‐inducing ligand (TRAIL; TNFSF10) and its cognate receptor(s) are up‐regulated in human and murine NASH.4, 5, 6, 7 Several observations suggest this enhanced ligand and receptor expression play a pivotal role in NASH pathogenesis. In vitro, hepatocyte treatment with palmitate, a saturated free fatty acid implicated in NAFLD pathogenesis, leads to TRAIL receptor (TRAIL‐R2, DR5) clustering in reorganized plasma membrane domains, causing ligand‐independent receptor activation and hepatocyte cell death.8 In a dietary mouse model of NASH, genetic deletion of the murine TRAIL receptor proved to be protective against many aspects of liver disease, including steatosis, hepatocyte apoptosis, macrophage‐associated inflammation, and fibrosis.9 In addition, inhibition of TRAIL receptor signaling may also have a direct effect on macrophages as TRAIL has been demonstrated to induce their proinflammatory activation in vitro.10, 11 However, it remains unknown whether TRAIL receptor activation in hepatocytes and macrophages in vivo occurs by a ligand‐dependent and/or ligand‐independent mechanism.
TRAIL receptor activation may lead to a wide variety of signaling cascades, culminating in diverse processes, such as apoptosis, proliferation, and proinflammatory signaling.12, 13, 14 TRAIL has been traditionally viewed as a death ligand, inducing apoptosis in sensitive cells. For example, healthy hepatocytes are resistant to TRAIL‐induced apoptosis; however, hepatocyte steatosis sensitizes them to TRAIL‐mediated cytotoxicity.15 Moreover, enhanced TRAIL expression has been reported to promote hepatic steatosis, which in turn may then sensitize the cells to TRAIL‐mediated cytotoxicity.16 In cell types such as macrophages or adipocytes, TRAIL appears to induce nonapoptotic signaling. For example, TRAIL can activate proinflammatory signaling in macrophages10, 11 and restrain preadipocyte differentiation without significantly effecting cell viability.17 In addition, TRAIL receptor ligation by TRAIL in activated hepatic stellate cells results in their apoptosis, depleting the liver of this cell type18 and thereby averting hepatic fibrogenesis. TRAIL‐mediated signaling may also reduce insulin resistance in vivo as systemic administration of TRAIL to mice on a high‐fat diet improved their insulin sensitivity and glucose clearance and decreased their adiposity.19 Thus, the downstream effect of TRAIL signaling is complex and varies depending on cell types and disease context.
In the context of NASH, a disease characterized by steatotic hepatocytes and activated proinflammatory macrophages, TRAIL may drive the progression of steatosis to NASH by promoting cell death and inflammation. Alternatively, TRAIL signaling could be salutary in this syndrome by improving insulin resistance and inhibiting activated hepatic stellate cell‐mediated fibrogenesis. Herein, we examined the effects of obesity on liver and adipose tissue inflammation and insulin resistance in wild‐type (WT) and TRAIL‐deficient (Trail –/–) mice. The data indicated that the lack of TRAIL expression reduces steatohepatitis but does not repress adipose tissue inflammation and actually aggravates insulin resistance. Thus, TRAIL is likely dispensable for cell injury and inflammation in adipose tissue whereas it contributes to liver injury and inflammation in the obesity‐induced model of murine NASH. We also compare and contrast the results in the Discussion to those observed in mice with a genetic deletion of the dedicated TRAIL receptor.
Materials and Methods
ANIMALS AND EXPERIMENTAL DESIGN
All animal studies were performed in accordance with and approved by the Institutional Animal Care and Use Committee at the Mayo Clinic. C57BL/6 mice (WT) were obtained from the Jackson Laboratory (Bar Harbor, ME). TRAIL knockout (Trail –/–) mice on the C57BL/6 genetic background were developed as described.20 Trail –/– mice develop normally and have no defects in lymphoid or myeloid cell homeostasis and function.21 Animals were housed with a 12‐hour light–dark cycle. WT and Trail –/– mice were not cohoused in the same cages. At 10 weeks of age, male mice (8‐11 per group) were placed on a diet high in saturated fat and cholesterol (40% calories from fat, 0.2% cholesterol) (AIN‐76A Western Diet; TestDiet, St. Louis, MO) with exogenous glucose plus fructose (42 g/L) added to the drinking water or were maintained on a standard chow and water ad libitum for 20 weeks. The former diet was termed the high‐saturated fat, high‐fructose, and high‐cholesterol (FFC) diet. This murine model of diet‐induced obesity results in the development of insulin resistance, adipose tissue inflammation, and NASH with hepatocyte ballooning and fibrosis, displaying high fidelity to human NASH.22, 23 At the end of the feeding period, mice were killed under general anesthesia induced by a combination of xylazine (10 mg/kg intraperitoneally) and ketamine (80 mg/kg intraperitoneally), and blood, epididymal fat, and liver samples were harvested for further analysis.
METABOLIC PHENOTYPING
At 18 weeks of the feeding period, mice were placed in fully automated metabolic chambers, and indirect calorimetry and voluntary activity were measured using the Oxymax System (Columbus Instruments, OH) as described.9 Due to differences in body mass between groups, all indirect calorimetry data were normalized to lean body mass. For blood fasting glucose and insulin analysis, mice were fasted for 6 hours. Fasting glucose was evaluated using a blood glucose monitor (Assure 4; Arkray, MN). Fasting insulin was measured using the Ultra‐Sensitive Mouse Insulin enzyme‐linked immunosorbent assay kit (Crystal Chem, IL) as per the manufacturer's instructions. The homeostatis model assessment of insulin resistance index was calculated as described.24
BIOCHEMICAL ANALYSIS
Serum alanine aminotransferase (ALT) activity was determined using a veterinary chemistry analyzer VS2 from VetScan (CA). Triglyceride concentrations in mouse liver homogenates were measured using the EnzyChrome triglyceride assay kit (BioAssay Systems) as described.24
HISTOPATHOLOGY, IMMUNOHISTOCHEMISTRY, SIRIUS RED STAINING, AND TERMINAL DEOXYNUCLEOTIDYL TRANSFERASE‐MEDIATED DEOXYURIDINE TRIPHOSPHATE NICK‐END LABELING ASSAY
For the histologic review, liver and epididymal adipose tissue were diced into 5 mm × 5 mm sections, fixed in 4% paraformaldehyde for 24 hours, and then embedded in paraffin. Tissue sections (4 μm) were prepared using a microtome (Reichert Scientific Instruments, Buffalo, NY) and placed on glass slides. Hematoxylin and eosin staining was performed according to standard techniques. For immunohistochemistry, paraformaldehyde‐fixed paraffin‐embedded liver and adipose tissue sections were deparaffinized, hydrated, and incubated with antibodies specific for Mac‐2 (1:250; eBioscience) or α‐smooth muscle actin (α‐SMA) (1:1,000; Abcam #ab124964). Bound antibodies were detected using the Vectastain ABC kit (Vector Laboratories, Burlingame, CA) and diaminobenzidine as a substrate, and the tissue sections were counterstained with hematoxylin. To quantify immunohistochemical staining, at least 10 random pictures of liver (20×) or adipose (10×) tissue per section were assessed by morphometry (ImageJ, National Institutes of Health). Liver fibrosis was quantified using Sirius Red staining. Direct Red 80 and Fast‐Green FCF (color index 42053) were obtained from Sigma‐Aldrich Diagnostics. Liver sections were stained, and red‐stained collagen fibers were quantified by digital image analysis using ImageJ. The fluorescent terminal deoxynucleotidyl transferase‐mediated deoxyuridine triphosphate nick‐end labeling (TUNEL) assay on liver and epididymal adipose tissue was performed on frozen and formalin‐fixed paraffin‐embedded sections, respectively. Briefly, liver tissue samples were cryopreserved in Tissue Tek optimum cutting temperature compound (Takeda, Deerfield, IL) immediately after removal. Tissue sections were cut at 7 μm on a cryomicrotome (Leica, Buffalo Grove, IL) and stored at −80°C until use. The TUNEL assay was then performed using the manufacturer's protocol (In Situ Cell Death Detection kit; Roche Life Science, Indianapolis, IN), and tissue slices were mounted with ProLong Gold antifade reagent with 4',6‐diamidino‐2‐phenylindole (Life Technologies, Grand Island, NY). In liver tissue, apoptotic cells were quantified by counting TUNEL‐positive nuclei per high‐power field in 20 random microscopic fields (20×) using a fluorescent microscope (Eclipse 80i; Nikon, West Lafayette, IN). Apoptotic cells in adipose tissue were quantified by counting TUNEL‐positive nuclei and all nuclei (4',6‐diamidino‐2‐phenylindole‐positive) in at least six random microscopic fields (10×), and the data were expressed as the percentage of TUNEL‐positive nuclei.
HYDROXYPROLINE ASSAY
To determine liver collagen content, hydroxyproline from the liver was measured by a colorimetric assay. Briefly, 100 mg of liver tissue was homogenized in ice‐cold distilled water, and an aliquot of the homogenate was used for DNA isolation and concentration measurement. For hydroxyproline measurement, HCl (12 M) was added to the homogenates, and samples were incubated at 95°C for 18 hours. After hydrolysis, 10 μL of the supernatant from the digested samples and hydroxyproline standards (Sigma, St. Louis, MO) were reacted with freshly made 0.072 M chloramine‐T at room temperature for 20 minutes, followed by freshly made 1 M Ehrlich's aldehyde solution at 65°C for 15 minutes. Absorbance values of the standards and samples were measured at 561 nm. Liver collagen content was expressed as hydroxyproline in nanograms per nanogram of DNA.
COHERENT ANTI‐STOKES RAMAN SCATTERING AND SECOND HARMONIC GENERATION MICROSCOPY
Label‐free frozen liver tissue sections (7 μm thick) were imaged on a two photon confocal microscope (FluoView FV1000 MPE; Olympus America, Center Valley, PA) using the coherent anti‐Stokes Raman scattering and second harmonic generation (SHG) applications as described by us.6 A Mai Tai DeepSea laser (Spectra‐Physics) was tuned to 800 nm, and an XLPlanN 25×/1.05w multiphoton physiology objective lens was used. For collagen quantification, the pixel numbers of the SHG image having intensity above the threshold value were quantified using ImageJ. Four animals per group and at least 10 pictures for each animal were examined.
QUANTITATIVE REAL‐TIME POLYMERASE CHAIN REACTION
Total RNA from liver and epididymal adipose tissue was isolated with TRIZOL reagent (Invitrogen, Carlsbad, CA) and was reverse transcribed with Moloney murine leukemia virus reverse transcriptase and oligo‐deoxythymine random primers (both from Invitrogen). Quantification of gene expression was performed by real‐time polymerase chain reaction using SYBR green fluorescence on a LightCycler 480 instrument (Roche). Specific primers are listed in Table 1. Target gene expression was calculated using the comparative computed tomography method. Expression was normalized to hypoxanthine phosphoribosyltransferase expression levels in liver and 18S expression levels in epididymal adipose tissue, which were stable across the four experimental groups. All data represent fold change over expression in WT mice fed the standard chow diet.
Table 1.
PRIMER SEQUENCES FOR QUANTITATIVE REAL‐TIME PCR IN MOUSE TISSUES
| Gene | Forward Primer Sequence (5′‐3′) | Reverse Primer Sequence (5′‐3′) |
|---|---|---|
| α‐SMA | GTC CCA GAC ATC AGG GAG TAA | TCG GAT ACT TCA GCG TCA GGA |
| Adiponectin | TGT TCC TCT TAA TCC TGC CCA | CCA ACC TGC ACA AGT TCC CTT |
| Caspase 1 | ACA AGG CAC GGG ACC TAT G | TCC CAG TCA GTC CTG GAA ATG |
| CCL2 | TTA AAA ACC TGG ATC GGA ACCA | GCA TTA GCT TCA GAT TTA CGG G |
| CCL3 | TTC TCT GTA CCA TGA CAC TCT GC | CGT GGA ATC TTC CGG CTG TAG |
| CCR2 | ATC CAC GGC ATA CTA TCA ACA TC | CAA GGC TCA CCA TCA TCG TAG |
| CD206 | CTC TGT TCA GCT ATT GGA CGC | CGG AAT TTC TGG GAT TCA GCT TC |
| CD68 | TGT CTG ATC TTG CTA GGA CCG | GAG AGT AAC GGC CTT TTT GTG A |
| C/EBPα | CAA GAA CAG CAA CGA GTA CCG | GTC ACT GGT CAA CTC CAG CAC |
| Collagen 1a1 | GCT CCT CTT AGG GGC CAC T | CCA CGT CTC ACC ATT GGG G |
| F4/80 | ATG GAC AAA CCA ACT TTC AAG GC | GCA GAC TGA GTT AGG ACC ACA A |
| FGF21 | AGA TCA GGG AGG ATG GAA CA | TCA AAG TGA GGC GAT CCA TA |
| HPRT1 | AAG GAC CTC TCG AAG TGT TGG ATA | CAT TTA AAA GGA ACT GTT GAC AAC G |
| IL‐1β | GCA ACT GTT CCT GAA CTC AAC T | ATC TTT TGG GGT CCG TCA ACT |
| IL‐6 | TAG TCC TTC CTA CCC CAA TTT CC | TTG GTC CTT AGC CAC TCC TTC |
| Leptin | GAG ACC CCT GTG TCG GTT C | CTG CGT GTG TGA AAT GTC ATT G |
| Ly6c | GCA GTG CTA CGA GTG CTA TGG | ACT GAC GGG TCT TTA GTT TCC TT |
| Nlrp3 | ATT ACC CGC CCG AGA AAG G | TCG CAG CAA AGA TCC ACA CAG |
| Perilipin 2 | CAG CCA ACG TCC GAG ATT G | CAC ATC CTT CGC CCC AGT T |
| SREBP‐1 | GAT GTG CGA ACT GGA CAC AG | CAT AGG GGG CGT CAA ACA G |
| TIMP‐1 | AGG TGG TCT CGT TGA TTT CT | GTA AGG CCT GTA GCT GTG CC |
| TNFα | CCC TCA CAC TCA GAT CAT CTT CT | GCT ACG ACG TGG GCT ACA G |
| TRAIL | ATG GTG ATT TGC ATA GTG CTC C | GCA AGC AGG GTC TGT TCA AGA |
| TRAIL‐R | CGG GCA GAT CAC TAC ACC C | TGT TAC TGG AAC AAA GAC AGC C |
| 18S | CGC TTC CTT ACC TGG TTG AT | GAG CGA CCA AAG GAA CCA TA |
Abbreviations: CCL2, chemokine (C‐C motif) ligand 2; CCL3, chemokine (C‐C motif) ligand 3; CCR2, C‐C motif chemokine receptor 2; CD, cluster of differentiation; C/EBPα, CCAAT/enhancer binding protein alpha; FGF21, fibroblast growth factor 21; HPRT1, hypoxanthine phosphoribosyltransferase 1; Nlrp3, NLR family pyrin domain containing 3; SREBP‐1, sterol regulatory element‐binding transcription factor 1; TIMP‐1, tissue inhibitor of metalloproteinases 1. TRAIL‐R, TRAIL receptor.
PROXIMITY LIGATION ASSAY
Paraformaldehyde‐fixed, paraffin‐embedded, epididymal adipose tissue sections were deparaffinized and hydrated. Heat‐induced antigen retrieval was performed using citrate buffer (pH 6.0). Tissue slices were incubated with anti‐Fas‐associated protein with death domain (FADD) rabbit antibody (1:100; 14906‐1‐AP; ProteinTech) and anti‐caspase 8 mouse antibody (1:100; 66093‐1‐Ig; ProteinTech) at 4°C overnight. For negative control staining, one of the primary antibodies was omitted. A proximity ligation assay (PLA) using Duolink In Situ PLA kit (Sigma) was performed according to the manufacturer's instructions. PLA staining was imaged on an LSM780 confocal microscope (Zeiss, Jena, Germany) using a 63× lens. The number of PLA+ dots was quantified in at least five images per animal (n = 3 per group) using ImageJ software.
STATISTICAL ANALYSIS
Data are expressed as the means ± SEM. Differences between groups were compared using one‐way analysis of variance followed by the Bonferroni post‐hoc test in which P < 0.05 was the minimum requirement for a statistically significant difference. All analyses were performed using GraphPad Prism 5.0 software (San Diego, CA).
Results
FFC DIET UP‐REGULATES TRAIL AND TRAIL‐R IN THE LIVER AND WHITE ADIPOSE TISSUE
We first examined expression of TRAIL and its receptor in the tissues critical for development of obesity‐induced NASH. Mice possess only a single ortholog of the two closely related human TRAIL receptors (TNFRSF10A and TNFRSF10B or TRAIL‐R1 and TRAIL‐R2, respectively).13 Although the mouse receptor has been referred to as death receptor 5, here we have referred to it as TRAIL‐R. Similar to reports in obese humans and patients with steatosis,4, 5, 25 obese C57BL/6 mice fed the FFC diet displayed a marked up‐regulation of TRAIL‐R in the liver and epididymal white adipose tissue (eWAT; Fig. 1A). TRAIL expression was also up‐regulated in both tissues in this murine model (Fig. 1B). These data suggest that these tissues may be more susceptible to TRAIL‐mediated signaling due to strong TRAIL‐R up‐regulation, a postulate which has been recently proposed.6
Figure 1.
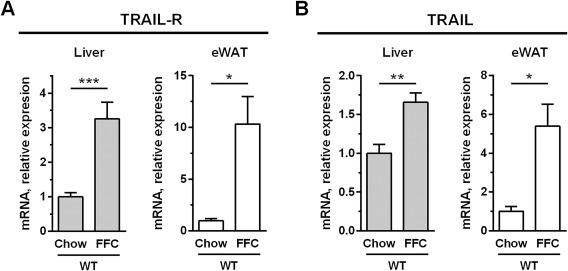
FFC diet up‐regulates TRAIL and TRAIL receptor in the liver and white adipose tissue. C57BL/6 mice were placed on standard chow or an FFC diet for 20 weeks. Liver and eWAT RNA were extracted, and murine TRAIL‐R and TRAIL expression were quantified by qPCR. Bars represent mean ± SEM. ***P < 0.001, **P < 0.01, *P < 0.05. Abbreviations: eWAT, epididymal white adipose tissue; qPCR, real‐time polymerase chain reaction.
METABOLIC PROFILE OF WT AND TRAIL –/– MICE FED THE FFC DIET
To explore the role of TRAIL in obesity‐induced NASH, C57BL/6 (WT) and Trail –/– mice were placed on standard chow or the FFC diet for 20 weeks. Both WT and Trail –/– mice on the FFC diet developed significant obesity (∼50 g of body weight) compared to standard chow‐fed mice (∼30 g of body weight; Fig. 2A). Weight gain and food intake did not differ between the genotypes on the same diet (not shown). All FFC diet‐fed mice had elevated concentrations of fasting glucose and insulin; the latter was further increased in Trail –/– mice (Fig. 2B,C). Likewise, the homeostatis model assessment of insulin resistance was increased in all FFC diet‐fed mice, and the increase was again more pronounced in Trail –/– mice (Fig. 2D). Additional metabolic parameters of WT and Trail –/– mice were assessed using automated metabolic chambers. We found no difference in oxygen consumption, energy expenditure, or respiratory quotient between the genotypes on either diet (Fig. 2E). Taken together, TRAIL deficiency did not affect body weight gain but aggravated insulin resistance induced by the FFC diet. These data are in accord with studies reporting improvement in insulin resistance in TRAIL‐treated animals.19
Figure 2.
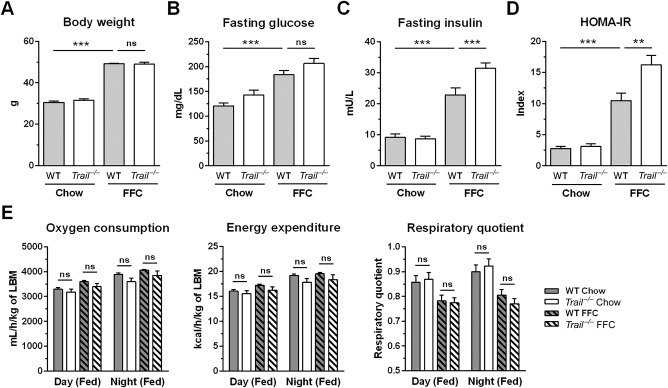
Metabolic phenotype of WT and Trail –/– mice fed the FFC diet. C57BL/6 (WT) and Trail –/– mice were fed standard chow or an FFC diet for 20 weeks. (A) Body weight at the time of sacrifice. (B,C) Blood fasting glucose and insulin. (D) HOMA‐IR. (E) At week 18 of the feeding study, mice were placed in metabolic chambers to assess oxygen consumption, energy expenditure, and respiratory quotient by indirect calorimetry. Bars represent mean ± SEM. ***P < 0.001, **P < 0.01. Abbreviations: HOMA‐IR, homeostatis model assessment of insulin resistance; LBM, lean body mass; ns, not significant.
TRAIL DEFICIENCY REDUCES LIVER WEIGHT, STEATOSIS, AND INJURY IN MICE FED THE FFC DIET
Consistent with our previous data,22 the FFC diet significantly increased liver weight and induced marked steatosis in WT mice (Fig. 3A,B,E). Interestingly, FFC diet‐fed Trail –/– mice displayed a significant decrease in liver weight compared to FFC‐fed WT mice (Fig. 3A). In line with the decreased liver weight, hepatic steatosis was attenuated in Trail –/– mice as assessed by biochemical quantification of neutral triglycerides, histology, and coherent anti‐Stokes Raman scattering microscopy (Fig. 3B,E). The FFC diet also caused liver injury as manifested by substantially elevated serum ALT values (Fig. 3C). In contrast, FFC diet‐fed Trail –/– mice displayed reduced serum ALT values compared to WT pair‐fed animals (164 U/L versus 321 U/L). As hepatocyte apoptosis is a prominent histopathologic feature of NASH,13 we next examined apoptosis in liver tissue samples using the TUNEL assay. As expected, WT mice on the FFC diet demonstrated a significant increase in liver TUNEL‐positive cells compared to standard chow‐fed animals (Fig. 3D,E). Consistent with the reduced serum ALT levels, FFC‐fed Trail –/– mice displayed a decrease in liver TUNEL‐positive cells compared to WT pair‐fed mice. These data collectively suggest that TRAIL deficiency reduces both hepatocyte steatosis and injury in FFC diet‐fed mice.
Figure 3.
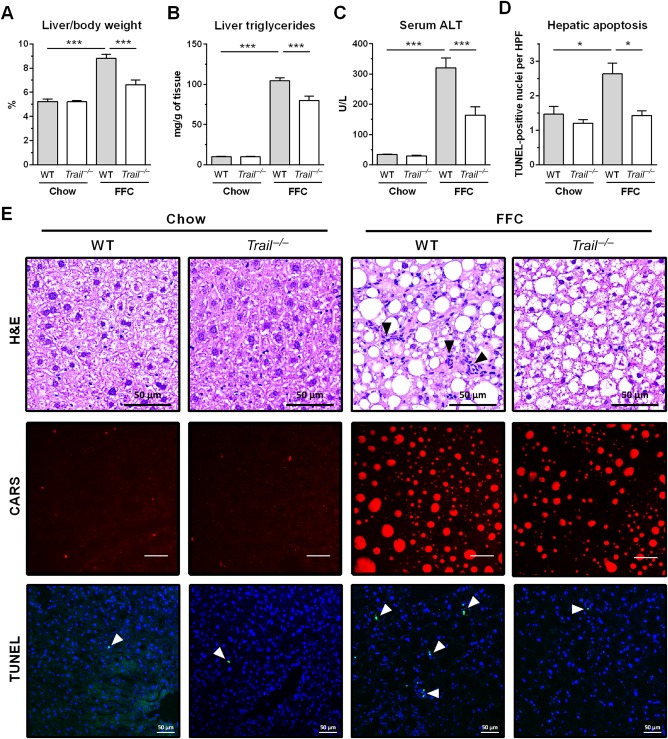
FFC diet‐fed Trail –/– mice have significantly decreased liver weight, steatosis, and injury. Livers were harvested at the end of the study for the following analyses: (A) Liver weight normalized to body weight; (B) triglycerides measured in liver homogenates using a biochemical assay; (C) liver injury assessed by serum ALT activity; (D) hepatic apoptosis quantified by counting TUNEL‐positive nuclei per high‐power field; (E) representative images of liver H&E staining (scale bar 50 μm), CARS microscopy on frozen label‐free liver sections (scale bar 50 μm), and TUNEL assay for liver apoptosis (scale bar 50 μm). Bars represent mean ± SEM. ***P < 0.001, *P < 0.05. Abbreviations: CARS, coherent anti‐Stokes Raman scattering; H&E, hematoxylin and eosin; HPF, high‐power field.
TRAIL DELETION REDUCES FFC DIET‐INDUCED ACCUMULATION OF MACROPHAGES IN THE LIVER
Liver and white adipose inflammation in NASH is characterized by infiltration and activation of monocyte‐derived macrophages.26, 27 Therefore, we explored the extent to which cells of this lineage accumulated in these tissues in our model. Using immunohistochemistry on liver tissue sections, we detected a substantial increase in Mac‐2 (galectin‐3)‐positive cells in the FFC diet‐fed WT mice compared to the chow‐fed WT mice (Fig. 4A,B), suggesting a marked accumulation of phagocytically active macrophages.28 This increase was markedly suppressed in FFC diet‐fed Trail –/– mice. In line with this observation, hepatic messenger RNA (mRNA) levels for cluster of differentiation (CD)68 (a general macrophage marker), CC chemokine receptor, and Ly6c (markers for infiltrating monocytes) were all increased in FFC diet‐fed WT mice and decreased in Trail –/– mice on the same diet (Fig. 4C,D). Macrophage activation was examined by measuring mRNA expression of proinflammatory cytokines and chemokines known to be secreted by activated macrophages. Indeed, hepatic mRNA levels for cytokines interleukin (IL)‐1β and TNFα, and chemokines (C‐C motif) ligand 2 and 3 were elevated in FFC‐fed WT mice (Fig. 4E,F). Again, levels of these proinflammatory cytokines and chemokines were significantly decreased in FFC‐fed Trail –/– mice compared to respective WT controls. Thus, these observations suggest that TRAIL deficiency represses FFC diet‐induced hepatic accumulation and activation of macrophages in the FFC model of NASH.
Figure 4.
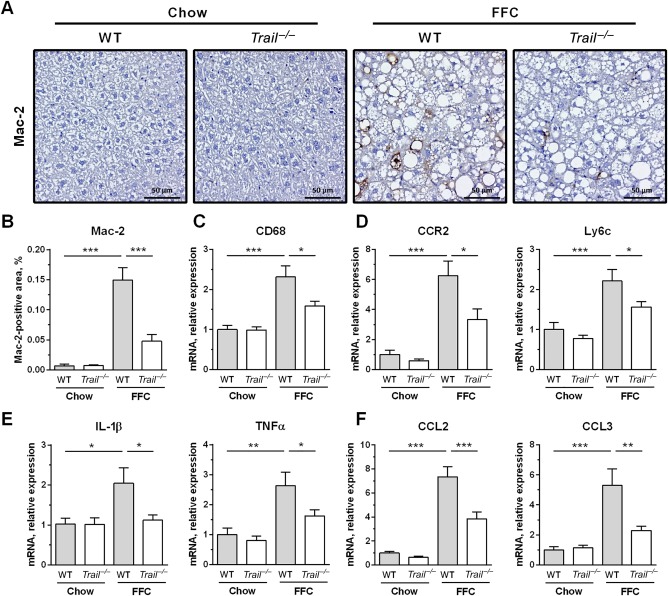
FFC diet‐fed Trail –/– mice display attenuated macrophage‐associated inflammation in the liver. (A,B) Immunohistochemistry for macrophage marker Mac‐2 (galectin‐3) on liver tissue sections (scale bar 50 μm) and its morphometric quantification. (C) Whole liver mRNA expression of pan‐macrophage marker CD68. (D) Liver mRNA expression of markers for infiltrating monocytes. (E) Liver mRNA expression of proinflammatory cytokines. (F) Liver mRNA expression of proinflammatory chemokines. Bars represent mean ± SEM. ***P < 0.001, **P < 0.01, *P < 0.05. Abbreviations: CCL2, chemokine (C‐C motif) ligand 2; CCL3, chemokine (C‐C motif) ligand 3; CCR2, C‐C motif chemokine receptor 2; CD, cluster of differentiation.
FFC DIET‐FED TRAIL –/– MICE DO NOT DEVELOP HEPATIC FIBROSIS
We next examined collagen tissue deposition using Sirius Red staining. Liver sections from FFC‐fed WT mice had a significantly increased area of excessive collagen matrix compared to mice on standard chow, which was completely reversed in FFC‐fed Trail –/– mice (Fig. 5A). These data were confirmed by SHG microscopy that specifically visualizes collagen fibrils and can be performed on frozen label‐free liver sections, thus avoiding tissue fixation and staining artifacts (Fig. 5A). Further, increased fibrogenesis in FFC‐fed WT mice was evidenced by increased abundance of activated hepatic stellate cells as assessed by immunohistochemistry for α‐SMA (Fig. 5A). The number of α‐SMA‐positive cells was significantly decreased in FFC‐fed Trail –/– mice. In addition, total liver collagen was assayed biochemically by measurement of hydroxyproline. FFC feeding in WT mice significantly increased liver hydroxyproline content compared to chow‐fed animals (Fig. 5B). In agreement with the above observations, there was no increase in hydroxyproline content when comparing chow and FFC‐fed Trail –/– mice. Finally, hepatic mRNA levels of collagen 1a1 as well as α‐SMA and tissue inhibitor of metalloproteinases 1, phenotypic markers for activated hepatic stellate cells, were all significantly up‐regulated in the FFC‐fed WT mice (Fig. 5C). Consistent with the histologic findings, TRAIL deficiency prevented the FFC diet‐induced up‐regulation of these profibrogenic genes. Thus, TRAIL deletion attenuates FFC‐diet‐induced liver fibrogenesis, presumably by decreasing liver inflammation and secondary hepatic stellate cell activation as inhibition of fibrogenesis due to hepatic stellate cell apoptosis would be blunted in Trail –/– mice.
Figure 5.
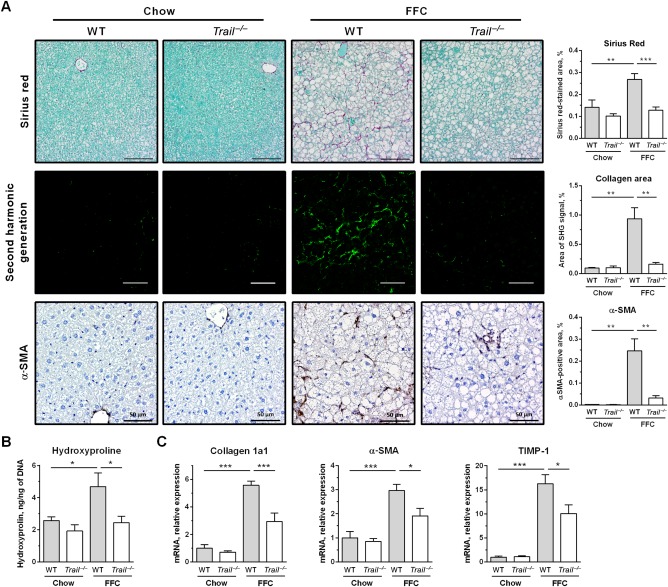
FFC diet‐fed Trail –/– mice are protected against liver fibrosis. (A) Representative images and corresponding morphometric analyses for Sirius Red staining (scale bar 100 μm), SHG microscopy on frozen label‐free liver sections (scale bar 50 μm), and immunohistochemistry for α‐SMA, a marker for activated hepatic stellate cells (scale bar 50 μm). (B) Biochemical determination of total collagen by hydroxyproline measurement in liver homogenates. (C) Liver RNA was extracted and qPCR was performed for markers for hepatic stellate cell activation. Bars represent mean ± SEM. ***P < 0.001, **P < 0.01, *P < 0.05. Abbreviations: qPCR, real‐time polymerase chain reaction; SHG, second harmonic generation; TIMP‐1, tissue inhibitor of metalloproteinases 1.
TRAIL DELETION DOES NOT IMPROVE WHITE ADIPOSE TISSUE INFLAMMATION
In both WT and Trail –/– mice, the FFC diet caused significant epididymal adipocyte hypertrophy and increased epididymal fat weight (Fig. 6A,B). Notably, the eWAT of the FFC‐fed Trail –/– mice was composed of significantly larger adipocytes than in FFC‐fed WT mice (Fig. 6C). Given the increased adiposity in FFC‐fed Trail –/– mice, we profiled expression of adipokines and key adipogenic genes. Adipokines, such as adiponectin, leptin, and fibroblast growth factor 21, were up‐regulated by the FFC diet, and there was a trend toward higher expression in Trail –/– mice compared to the WT mice, although the data did not reach statistical significance (Fig. 6D). Compared to FFC‐fed WT mice, FFC‐fed Trail –/– mice displayed significantly increased expression of perilipin 2 (Fig. 6E), a lipid droplet‐associated protein that serves as a marker for cellular lipid accumulation.29 There was also a trend for increased gene expression of key proadipogenic transcription factors, such as sterol regulatory element‐binding transcription factor 1 and CCAAT/enhancer binding protein alpha, in FFC‐fed Trail –/– mice compared to WT mice (Fig. 6E). Although in humans, adipocyte size has been positively correlated with NASH‐associated liver injury,30, 31 it appears that in experimental models the link between adipose tissue adiposity and liver injury may be dissociated. Perhaps the increased lipid‐buffering capacity of eWAT may protect liver from steatosis and injury, in agreement with the concept that adipose tissue expansion may be protective against diet‐induced metabolic damage.32 We next examined TRAIL receptor signaling in the eWAT. TRAIL‐R expression was up‐regulated by the FFC diet to a similar extent in both WT and Trail –/– mice (Fig. 6F). The FFC diet also caused a significant increase in adipose tissue cell death, which was not affected by TRAIL deficiency as assessed by the TUNEL assay (Fig. 6G,H). To assess the presence of TRAIL‐R intracellular signaling in the eWAT, we performed a PLA. TRAIL‐R signaling is initiated by formation of a complex composed of FADD and caspase 8. Using anti‐FADD and anti‐caspase 8‐specific antibodies together with the PLA, we observed that complexes containing caspase 8 and FADD are much more abundant in adipose tissue of FFC‐fed animals compared to chow‐fed animals (Fig. 6I‐K). There was no statistical difference in abundance of this complex between FFC‐fed WT and FFC‐fed Trail –/– mice, suggesting that TRAIL‐R signaling was preserved in the adipose tissue in the absence of the ligand.
Figure 6.
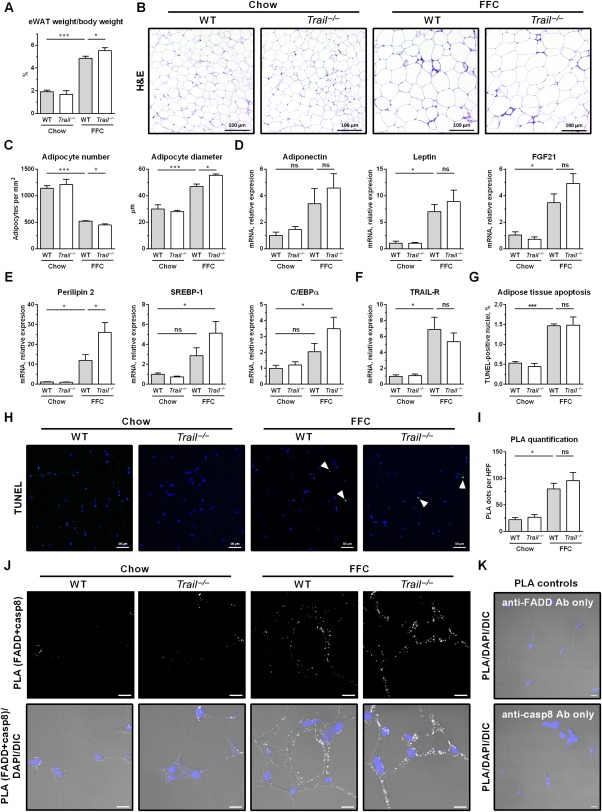
FFC diet‐fed Trail –/– mice display slightly increased adiposity in white adipose tissue. eWAT was harvested at the end of the study for the following analyses: (A) eWAT weight normalized to body weight; (B) H&E staining (scale bar 100 μm); (C) adipocyte number and size was quantified using H&E images and ImageJ software; (D‐F) eWAT total RNA was extracted and qPCR was performed for (D) adipokines, (E) adipogenic markers, and (F) TRAIL‐R. (G,H) Representative images of eWAT TUNEL staining for apoptotic nuclei (white arrowhead) and its quantification. (I,J) PLA quantification and representative images (scale bar 10 μm). PLA was performed on eWAT slices using anti‐FADD and anti‐caspase‐8 antibodies. Number of PLA dots was quantified by ImageJ software. (K) PLA control conditions using a single antibody. Representative images of FFC‐fed WT mice (scale bar 10 μm). Bars represent mean ± SEM. ***P < 0.001, *P < 0.05. Abbreviations: casp8, caspase‐8; C/EBPα, CCAAT/enhancer binding protein alpha; DAPI, 4',6‐diamidino‐2‐phenylindole; DIC, differential interference contrast; FGF21, fibroblast growth factor 21; H&E, hematoxylin and eosin; HPF, high‐power field; ns, not significant; SREBP‐1, sterol regulatory element‐binding transcription factor 1.
Along with the increased adiposity, the FFC diet also led to marked adipose tissue inflammation as manifested by abundant crown‐like structures, which are formed by macrophages and other immune cells (Fig. 6B). This observation was confirmed by immunohistochemistry for macrophage marker Mac‐2 (Fig. 7A,B). We further assessed macrophage‐associated inflammation in the eWAT by profiling the mRNA expression of markers for infiltrating monocytes/macrophages. Macrophage markers (F4/80, CD68, CD206), markers for infiltrating monocytes (C‐C motif chemokine receptor 2, Ly6c), proinflammatory cytokines (TNFα, IL‐1β, IL‐6), as well as components of the NLR family pyrin domain containing 3 inflammasome were all significantly increased by the FFC diet (Fig. 7C‐F). In striking contrast to the observations in liver where monocyte/macrophage proinflammatory markers were markedly decreased by TRAIL deletion, these markers in eWAT were not decreased in Trail –/– mice fed the FFC diet when compared to WT mice on the FFC diet. In aggregate, these data demonstrate that TRAIL deletion exerts a dichotomous effect in the FFC model, attenuating liver injury and inflammation while minimally affecting adipose tissue inflammation (Fig. 8).
Figure 7.
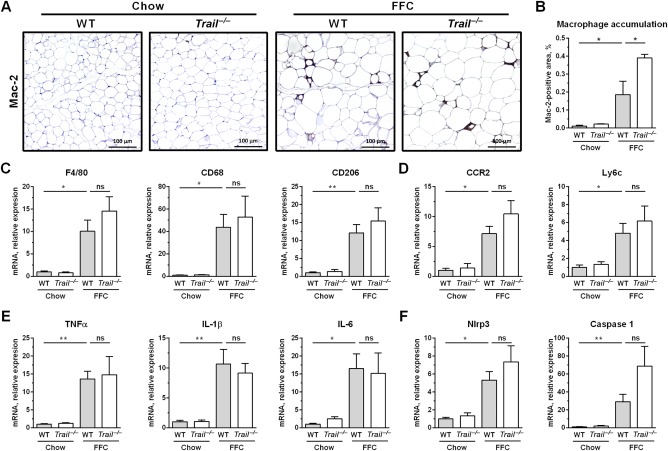
FFC diet‐fed Trail –/– mice have a similar degree of white adipose tissue inflammation. eWAT was harvested at the end of the study for the following analyses: (A,B) Mac‐2 (galectin‐3) immunohistochemistry and its quantification by morphometry (scale bar 100 μm); (C‐F) eWAT total RNA was extracted and qPCR was performed for (C) macrophage markers, (D) markers for infiltrating monocytes, (E) proinflammatory cytokines, and (F) components of the Nlrp3 inflammasome. Bars represent mean ± SEM. **P < 0.01, *P < 0.05. Abbreviations: CCR2, C‐C motif chemokine receptor 2; CD, cluster of differentiation; Nlrp3, NLR family pyrin domain containing 3; ns, not significant; qPCR, real‐time polymerase chain reaction.
Figure 8.
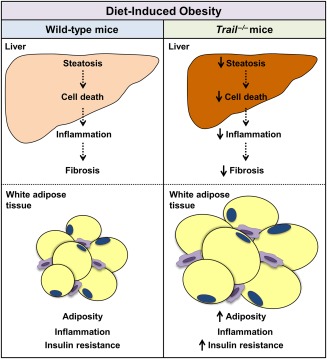
Schematic illustrating the role of TRAIL in NASH. In a model of diet‐induced obesity, TRAIL contributes to the development of NASH through increased hepatic cell death, inflammation, and fibrosis. Under the same conditions, TRAIL is dispensable for cell death and inflammation in adipose tissue.
Discussion
Since its discovery in 1995,33 the majority of work investigating the function of TRAIL has focused on its unique ability compared to other death‐inducing ligands to selectively kill tumor cells and leave normal cells and tissues unaffected. As the reagents, including knockout and transgenic mice, became more plentiful to study the in vivo function of TRAIL, it quickly became apparent that TRAIL plays important roles in numerous noncancerous settings under natural and pathophysiologic conditions.34 In the present study, we explored the noncancerous role of TRAIL signaling in tissue inflammation during an obesity‐inducing diet, which can be compared and contrasted with prior observations in TRAIL receptor knockout (Trail‐R –/–) mice. Our current data indicate that TRAIL is dispensable for cell death and inflammation in adipose tissue whereas it contributes to liver injury and inflammation in a model of diet‐induced obesity. These observations in adipose tissue are discordant from the observations in Trail‐R –/– animals, which were protected from weight gain, increases in adiposity, and insulin resistance in the same model. In contrast, both Trail –/– and Trail‐R –/– mice are protected from NASH. The interpretation of these results is discussed in more detail below.
In contrast to the findings on adiposity and insulin resistance, the findings between the current study and our previous study9 in regards to the liver phenotype of Trail –/– and Trail‐R –/– mice are in concordance. Deletion of TRAIL or TRAIL receptor reduces hepatic steatosis, liver cell death, hepatic inflammation, and fibrosis. These findings are consistent with prior observations suggesting that liver overexpression of TRAIL promotes liver steatosis16 and that steatotic hepatocytes are sensitized to TRAIL cytotoxic signaling in vitro and in vivo.6, 15 TRAIL proapoptotic signaling can also mediate release of proinflammatory extracellular vesicles by hepatocytes, which in turn promote macrophage‐associated inflammation.10, 35 TRAIL signaling in hepatocytes therefore appears to be canonical death receptor signaling with caspase 8 activation.13 These observations provide a mechanistic insight into the beneficial effects of the caspase 8 inhibitor emricasan (IDN‐6556) in a murine model of diet‐induced NASH.36 Presumably, emricasan is inhibiting TRAIL proapoptotic signaling in hepatocytes, thereby attenuating NASH pathogenesis.
In vitro, palmitate‐mediated hepatocyte cytotoxicity is TRAIL receptor dependent and ligand independent. Palmitate induces TRAIL‐R2 aggregation in the plasma membrane microdomains, leading to receptor oligomerization and activation and culminating eventually in caspase‐dependent cell death.8 Recent studies also demonstrated that similar events may occur in intracellular membranes during endoplasmic reticulum stress, promoting ligand‐independent TRAIL‐R2‐dependent cell death.37 However, the extent to which TRAIL receptor‐mediated hepatic injury in mice is ligand dependent or independent has not been established until now. In the current study, Trail –/– mice displayed an approximately 50% decrease in ALT values and a reduction in hepatic apoptosis, suggesting that TRAIL ligand‐dependent rather than ligand‐independent mechanisms contribute to hepatocyte damage in an obesity‐induced mouse model of NASH.
In our prior study, absence of the dedicated TRAIL receptor reduced weight gain and adiposity and improved insulin resistance in the FFC diet NASH model.9 In contrast in the current study, genetic absence of TRAIL did not affect weight gain and actually increased adiposity and aggravated insulin resistance. These differences between deletion of TRAIL or its receptor on weight gain, adiposity, and insulin resistance were unexpected. However, the observation that genetic TRAIL ablation worsens insulin resistance is consistent with prior observations in Apoe –/– mice fed a high‐fat diet38 and in studies demonstrating that TRAIL administration improved glucose clearance and insulin resistance.19 Differences between ligand‐dependent versus ligand‐independent TRAIL receptor signaling could account for these observations. For example, TRAIL receptor signaling in the liver is likely ligand dependent as discussed above. However, it may well be ligand independent in adipose tissue. Ligand‐independent TRAIL receptor signaling in adipose tissue may promote adiposity and inflammation in vivo. In the absence of the TRAIL receptor, such signaling would not occur and adiposity would be restrained as observed in our prior study.9
In conclusion, TRAIL was found dispensable for cell death and inflammation in adipose tissue whereas it likely contributes to liver injury in diet‐induced NASH in mice. By preventing injury, loss of TRAIL actually reduces liver inflammation and fibrosis. Thus, liver‐selective inhibition of TRAIL signaling may attenuate NASH during obesity. In addition, our findings support the concept that hepatic fibrosis in NASH appears to be dependent on hepatocyte damage and can be disassociated from metabolic syndrome with insulin resistance.
Author names in bold designate shared co‐first authorship.
Acknowledgment
We thank Dr. Nathan LeBrasseur and his laboratory for aiding in the metabolic studies.
Potential conflict of interest: Nothing to report.
Supported by National Institutes of Health grants DK41876 (to G.J.G.), GM115462 (to T.S.G.), K08DK111397 (to S.H.I.), the National Institute of Diabetes and Digestive and Kidney Diseases‐funded Optical Microscopy Core of the Mayo Clinic Center for Cell Signaling in Gastroenterology (P30DK084567), and the Mayo Clinic. Support was also provided to S.H.I. by the North American Society for Pediatric Gastroenterology, Hepatology and Nutrition/Nestle Nutrition Young Investigator Award and to P.H. by the American Liver Foundation and Edward C. Kendall Research Fellowship Award.
REFERENCES
- 1. Rinella ME. Nonalcoholic fatty liver disease: a systematic review. JAMA 2015;313:2263‐2273. [DOI] [PubMed] [Google Scholar]
- 2. Rinella M, Charlton M. The globalization of nonalcoholic fatty liver disease: prevalence and impact on world health. Hepatology 2016;64:19‐22. [DOI] [PubMed] [Google Scholar]
- 3. Hirsova P, Ibrabim SH, Gores GJ, Malhi H. Lipotoxic lethal and sublethal stress signaling in hepatocytes: relevance to NASH pathogenesis. J Lipid Res 2016;57:1758‐1770. [DOI] [PMC free article] [PubMed] [Google Scholar]
- 4. Cayon A, Crespo J, Guerra AR, Pons‐Romero F. [Gene expression in obese patients with non‐alcoholic steatohepatitis]. Rev Esp Enferm Dig 2008;100:212‐218 [in Spanish]. [DOI] [PubMed] [Google Scholar]
- 5. Volkmann X, Fischer U, Bahr MJ, Ott M, Lehner F, Macfarlane M, et al. Increased hepatotoxicity of tumor necrosis factor‐related apoptosis‐inducing ligand in diseased human liver. Hepatology 2007;46:1498‐1508. [DOI] [PubMed] [Google Scholar]
- 6. Hirsova P, Ibrahim SH, Bronk SF, Yagita H, Gores GJ. Vismodegib suppresses TRAIL‐mediated liver injury in a mouse model of nonalcoholic steatohepatitis. PloS One 2013;8:e70599. [DOI] [PMC free article] [PubMed] [Google Scholar]
- 7. Affo S, Dominguez M, Lozano JJ, Sancho‐Bru P, Rodrigo‐Torres D, Morales‐Ibanez O, et al. Transcriptome analysis identifies TNF superfamily receptors as potential therapeutic targets in alcoholic hepatitis. Gut 2013;62:452‐460. [DOI] [PMC free article] [PubMed] [Google Scholar]
- 8. Cazanave SC, Mott JL, Bronk SF, Werneburg NW, Fingas CD, Meng XW, et al. Death receptor 5 signaling promotes hepatocyte lipoapoptosis. J Biol Chem 2011;286:39336‐39348. [DOI] [PMC free article] [PubMed] [Google Scholar]
- 9. Idrissova L, Malhi H, Werneburg NW, LeBrasseur NK, Bronk SF, Fingas C, et al. TRAIL receptor deletion in mice suppresses the inflammation of nutrient excess. J Hepatol 2015;62:1156‐1163. [DOI] [PMC free article] [PubMed] [Google Scholar]
- 10. Hirsova P, Ibrahim SH, Krishnan A, Verma VK, Bronk SF, Werneburg NW, et al. Lipid‐induced signaling causes release of inflammatory extracellular vesicles from hepatocytes. Gastroenterology 2016;150:956‐967. [DOI] [PMC free article] [PubMed] [Google Scholar]
- 11. Gao J, Wang D, Liu D, Liu M, Ge Y, Jiang M, et al. Tumor necrosis factor‐related apoptosis‐inducing ligand induces the expression of proinflammatory cytokines in macrophages and re‐educates tumor‐associated macrophages to an antitumor phenotype. Mol Biol Cell 2015;26:3178‐3189. [DOI] [PMC free article] [PubMed] [Google Scholar]
- 12. Azijli K, Weyhenmeyer B, Peters GJ, de Jong S, Kruyt FA. Non‐canonical kinase signaling by the death ligand TRAIL in cancer cells: discord in the death receptor family. Cell Death Differ 2013;20:858‐868. [DOI] [PMC free article] [PubMed] [Google Scholar]
- 13. Hirsova P, Gores GJ. Death receptor‐mediated cell death and proinflammatory signaling in nonalcoholic steatohepatitis. Cell Mol Gastroenterol Hepatol 2015;1:17‐27. [DOI] [PMC free article] [PubMed] [Google Scholar]
- 14. Siegmund D, Lang I, Wajant H. Cell death‐independent activities of the death receptors CD95, TRAILR1, and TRAILR2. FEBS J 2017;284:1131‐1159. [DOI] [PubMed] [Google Scholar]
- 15. Malhi H, Barreyro FJ, Isomoto H, Bronk SF, Gores GJ. Free fatty acids sensitise hepatocytes to TRAIL mediated cytotoxicity. Gut 2007;56:1124‐1131. [DOI] [PMC free article] [PubMed] [Google Scholar]
- 16. Mundt B, Wirth T, Zender L, Waltemathe M, Trautwein C, Manns MP, et al. Tumour necrosis factor related apoptosis inducing ligand (TRAIL) induces hepatic steatosis in viral hepatitis and after alcohol intake. Gut 2005;54:1590‐1596. [DOI] [PMC free article] [PubMed] [Google Scholar]
- 17. Zoller V, Funcke JB, Keuper M, Abd El Hay M, Debatin KM, Wabitsch M, et al. TRAIL (TNF‐related apoptosis‐inducing ligand) inhibits human adipocyte differentiation via caspase‐mediated downregulation of adipogenic transcription factors. Cell Death Dis 2016;7:e2412. [DOI] [PMC free article] [PubMed] [Google Scholar]
- 18. Oh Y, Park O, Swierczewska M, Hamilton JP, Park JS, Kim TH, et al. Systemic PEGylated TRAIL treatment ameliorates liver cirrhosis in rats by eliminating activated hepatic stellate cells. Hepatology 2016;64:209‐223. [DOI] [PMC free article] [PubMed] [Google Scholar]
- 19. Bernardi S, Zauli G, Tikellis C, Candido R, Fabris B, Secchiero P, et al. TNF‐related apoptosis‐inducing ligand significantly attenuates metabolic abnormalities in high‐fat‐fed mice reducing adiposity and systemic inflammation. Clin Sci 2012;123:547‐555. [DOI] [PubMed] [Google Scholar]
- 20. Guicciardi ME, Krishnan A, Bronk SF, Hirsova P, Griffith TS, Gores GJ. Biliary tract instillation of a SMAC mimetic induces TRAIL‐dependent acute sclerosing cholangitis‐like injury in mice. Cell Death Dis 2017;8:e2535. [DOI] [PMC free article] [PubMed] [Google Scholar]
- 21. Sedger LM, Glaccum MB, Schuh JC, Kanaly ST, Williamson E, Kayagaki N, Yun T, et al. Characterization of the in vivo function of TNF‐alpha‐related apoptosis‐inducing ligand, TRAIL/Apo2L, using TRAIL/Apo2L gene‐deficient mice. Eur J Immunol 2002;32:2246‐2254. [DOI] [PubMed] [Google Scholar]
- 22. Charlton M, Krishnan A, Viker K, Sanderson S, Cazanave S, McConico A, et al. Fast food diet mouse: novel small animal model of NASH with ballooning, progressive fibrosis, and high physiological fidelity to the human condition. Am J Physiol Gastrointest Liver Physiol 2011;301:G825‐G834. [DOI] [PMC free article] [PubMed] [Google Scholar]
- 23. Krishnan A, Abdullah TS, Mounajjed T, Hartono S, McConico A, White T, et al. A longitudinal study of whole body, tissue and cellular physiology in a mouse model of fibrosing NASH with high fidelity to the human condition. Am J Physiol Gastrointest Liver Physiol 2017:312;G666‐G680. [DOI] [PMC free article] [PubMed] [Google Scholar]
- 24. Tomita K, Freeman BL, Bronk SF, LeBrasseur NK, White TA, Hirsova P, et al. CXCL10‐mediates macrophage, but not other innate immune cells‐associated inflammation in murine nonalcoholic steatohepatitis. Sci Rep 2016;6:28786. [DOI] [PMC free article] [PubMed] [Google Scholar]
- 25. Keuper M, Wernstedt Asterholm I, Scherer PE, Westhoff MA, Moller P, Debatin KM, et al. TRAIL (TNF‐related apoptosis‐inducing ligand) regulates adipocyte metabolism by caspase‐mediated cleavage of PPARgamma. Cell Death Dis 2013;4:e474. [DOI] [PMC free article] [PubMed] [Google Scholar]
- 26. Baffy G. Kupffer cells in non‐alcoholic fatty liver disease: the emerging view. J Hepatol 2009;51:212‐223. [DOI] [PMC free article] [PubMed] [Google Scholar]
- 27. Osborn O, Olefsky JM. The cellular and signaling networks linking the immune system and metabolism in disease. Nat Med 2012;18:363‐374. [DOI] [PubMed] [Google Scholar]
- 28. Sano H, Hsu DK, Apgar JR, Yu L, Sharma BB, Kuwabara I, et al. Critical role of galectin‐3 in phagocytosis by macrophages. J Clin Invest 2003;112:389‐397. [DOI] [PMC free article] [PubMed] [Google Scholar]
- 29. Conte M, Franceschi C, Sandri M, Salvioli S. Perilipin 2 and age‐related metabolic diseases: a new perspective. Trends Endocrinol Meta. 2016;27:893‐903. [DOI] [PubMed] [Google Scholar]
- 30. Wree A, Schlattjan M, Bechmann LP, Claudel T, Sowa JP, Stojakovic T, et al. Adipocyte cell size, free fatty acids and apolipoproteins are associated with non‐alcoholic liver injury progression in severely obese patients. Metabolism 2014;63:1542‐1552. [DOI] [PubMed] [Google Scholar]
- 31. du Plessis J, van Pelt J, Korf H, Mathieu C, van der Schueren B, Lannoo M, et al. Association of adipose tissue inflammation with histologic severity of nonalcoholic fatty liver disease. Gastroenterology 2015;149:635‐648. [DOI] [PubMed] [Google Scholar]
- 32. Kusminski CM, Bickel PE, Scherer PE. Targeting adipose tissue in the treatment of obesity‐associated diabetes. Nat Rev Drug Discov 2016;15:639‐660. [DOI] [PubMed] [Google Scholar]
- 33. Wiley SR, Schooley K, Smolak PJ, Din WS, Huang CP, Nicholl JK, et al. Identification and characterization of a new member of the TNF family that induces apoptosis. Immunity 1995;3:673‐682. [DOI] [PubMed] [Google Scholar]
- 34. Amarante‐Mendes GP, Griffith TS. Therapeutic applications of TRAIL receptor agonists in cancer and beyond. Pharmacol Ther 2015;155:117‐131. [DOI] [PMC free article] [PubMed] [Google Scholar]
- 35. Ibrahim SH, Hirsova P, Tomita K, Bronk SF, Werneburg NW, Harrison SA, et al. Mixed lineage kinase 3 mediates release of C‐X‐C motif ligand 10‐bearing chemotactic extracellular vesicles from lipotoxic hepatocytes. Hepatology 2016. 63:731‐744. [DOI] [PMC free article] [PubMed] [Google Scholar]
- 36. Barreyro FJ, Holod S, Finocchietto PV, Camino AM, Aquino JB, Avagnina A, et al. The pan‐caspase inhibitor Emricasan (IDN‐6556) decreases liver injury and fibrosis in a murine model of non‐alcoholic steatohepatitis. Liver Int 2015;35:953‐966. [DOI] [PubMed] [Google Scholar]
- 37. Lu M, Lawrence DA, Marsters S, Acosta‐Alvear D, Kimmig P, Mendez AS, et al. Cell death. Opposing unfolded‐protein‐response signals converge on death receptor 5 to control apoptosis. Science 2014;345:98‐101. [DOI] [PMC free article] [PubMed] [Google Scholar]
- 38. Di Bartolo BA, Chan J, Bennett MR, Cartland S, Bao S, Tuch BE, et al. TNF‐related apoptosis‐inducing ligand (TRAIL) protects against diabetes and atherosclerosis in Apoe–/– mice. Diabetologia 2011;54:3157‐3167. [DOI] [PubMed] [Google Scholar]


