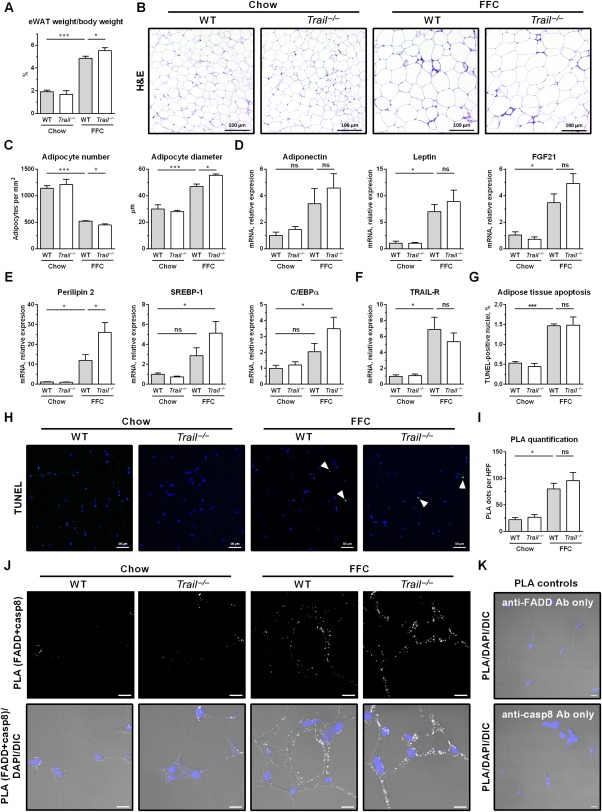
Figure 6.

FFC diet‐fed Trail –/– mice display slightly increased adiposity in white adipose tissue. eWAT was harvested at the end of the study for the following analyses: (A) eWAT weight normalized to body weight; (B) H&E staining (scale bar 100 μm); (C) adipocyte number and size was quantified using H&E images and ImageJ software; (D‐F) eWAT total RNA was extracted and qPCR was performed for (D) adipokines, (E) adipogenic markers, and (F) TRAIL‐R. (G,H) Representative images of eWAT TUNEL staining for apoptotic nuclei (white arrowhead) and its quantification. (I,J) PLA quantification and representative images (scale bar 10 μm). PLA was performed on eWAT slices using anti‐FADD and anti‐caspase‐8 antibodies. Number of PLA dots was quantified by ImageJ software. (K) PLA control conditions using a single antibody. Representative images of FFC‐fed WT mice (scale bar 10 μm). Bars represent mean ± SEM. ***P < 0.001, *P < 0.05. Abbreviations: casp8, caspase‐8; C/EBPα, CCAAT/enhancer binding protein alpha; DAPI, 4',6‐diamidino‐2‐phenylindole; DIC, differential interference contrast; FGF21, fibroblast growth factor 21; H&E, hematoxylin and eosin; HPF, high‐power field; ns, not significant; SREBP‐1, sterol regulatory element‐binding transcription factor 1.
