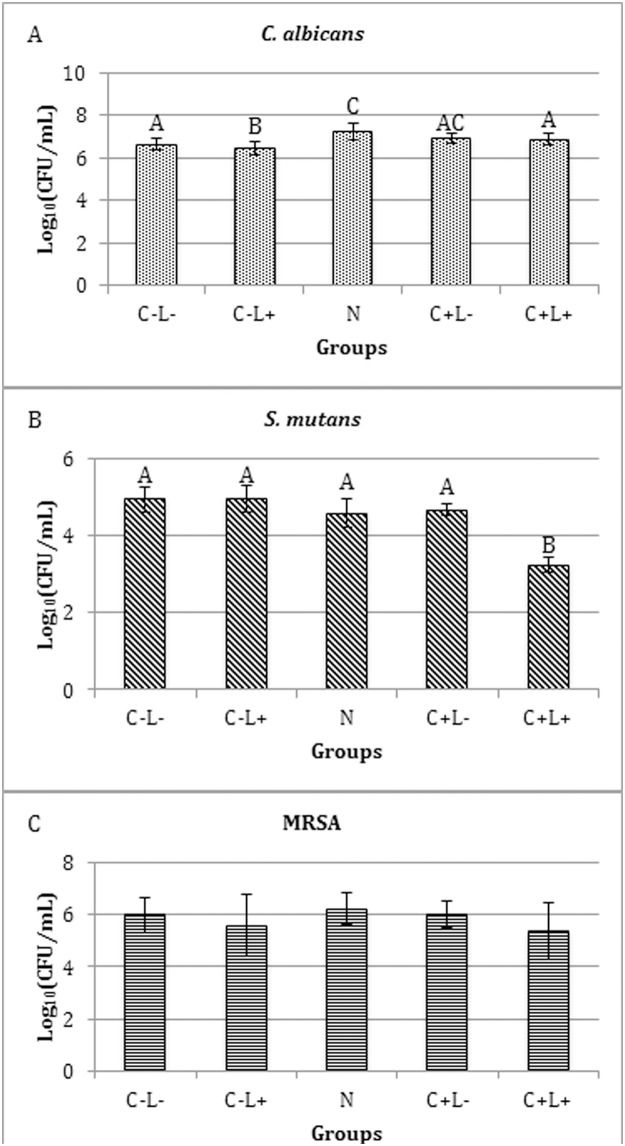
Fig 8. Values of log10(CFU/mL) of mono-species biofilm treated with anionic CUR-NP.
(A) C. albicans, (B) S. mutans and (C) MRSA. Bars charts show mean and standard deviation (error bars). The same letters show no statistical difference. C-L-: Control group without PS nor light. N: Biofilm treated with anionic NP without CUR. C-L+: Biofilm treated only with light (43.2 J/cm2). C+L-: Biofilm treated only with anionic CUR-NP at 260 μM. C+L+: Biofilm submitted to aPDT with anionic CUR-NP at 260 μM and 43.2 J/cm2.

