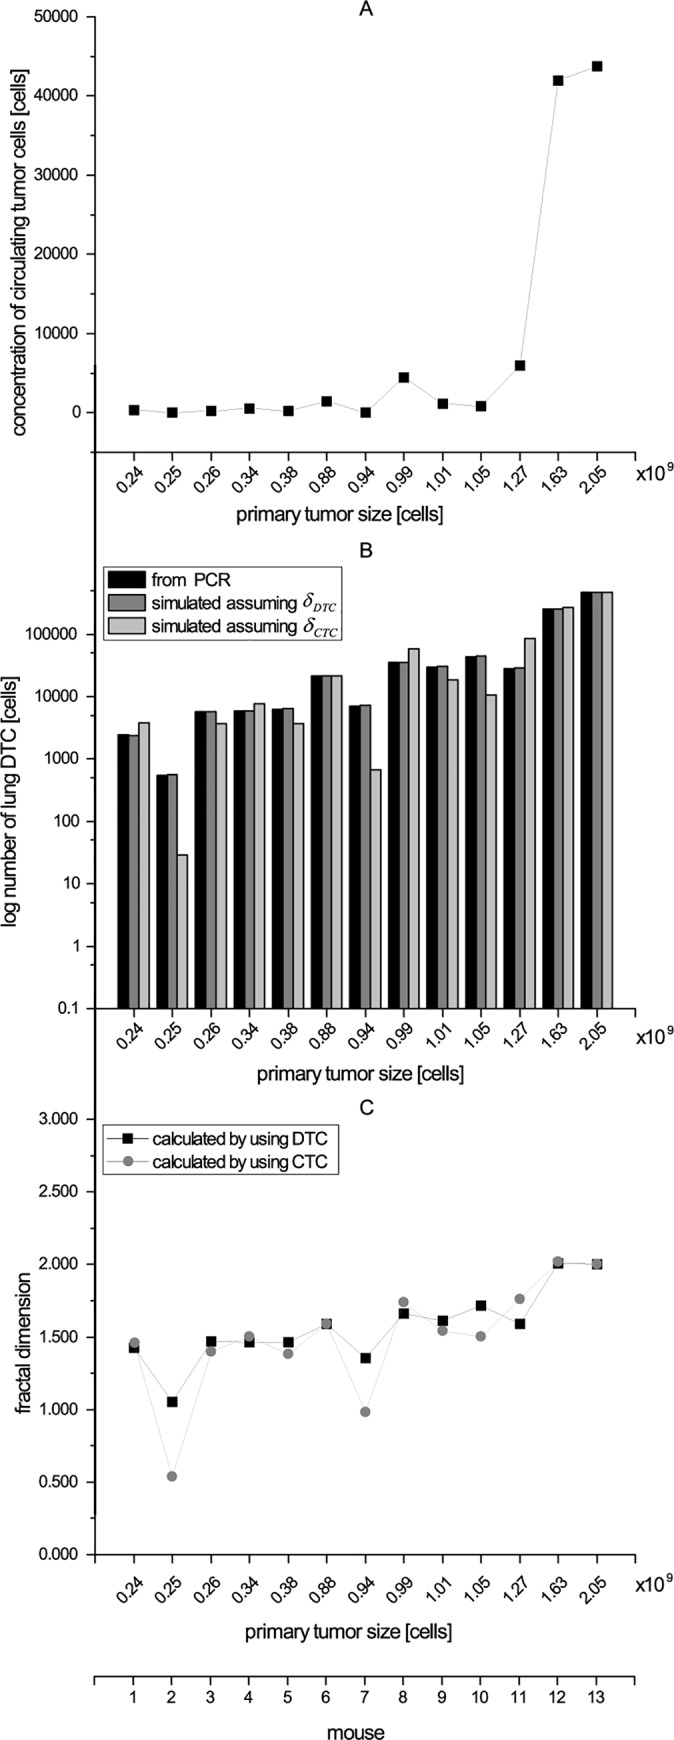
Fig 3. The effect of tumor size on tumor vasculature.

Panel A shows the relationship between the size of the primary tumor and the concentration of CTC. In panel B the numbers of disseminated tumor cells, which were determined by PCR, and the calculated number of disseminated tumor cells using two evaluation methods are compared: Fractal dimension (DTC)—the fractal dimension δDTC was adjusted until the number of DTCSim reached the number of DTCPCR. Fractal dimension (CTC)—the fractal dimension δCTC was computed based on the number of circulating tumor cells. Panel C compares the fractal dimension based on both evaluation methods. In all panels, the values are sorted by the size of the primary tumor in ascending order (x-axis primary tumor size [cells]).
