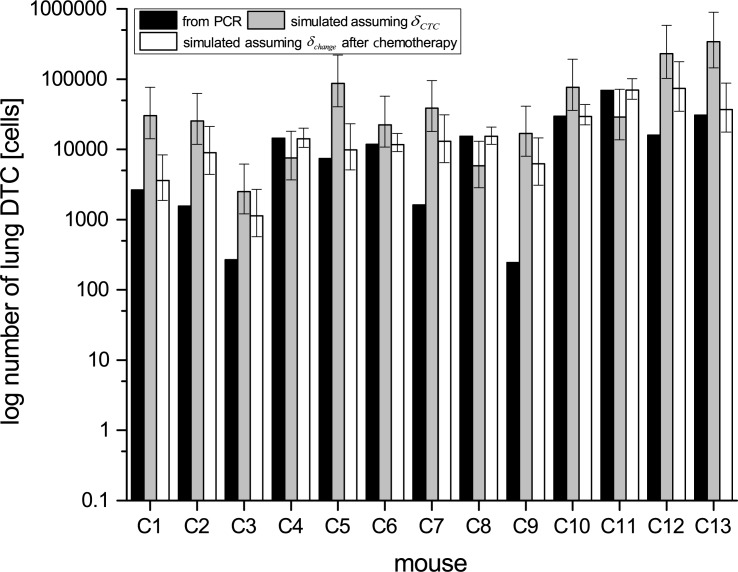
Fig 5. Number of disseminated tumor cells (DTCs) in the lung of mice in the chemotherapy group measured by PCR (black bars) compared with results from simulations with computed fractal dimension (grey bars) and adjusted fractal dimension (white bars).
Simulation results with adjusted fractal dimension fit better to experimental data. Asterisks indicate mice, where simulations with adjusted fractal dimension are in the range of the statistical error with the measured values.

