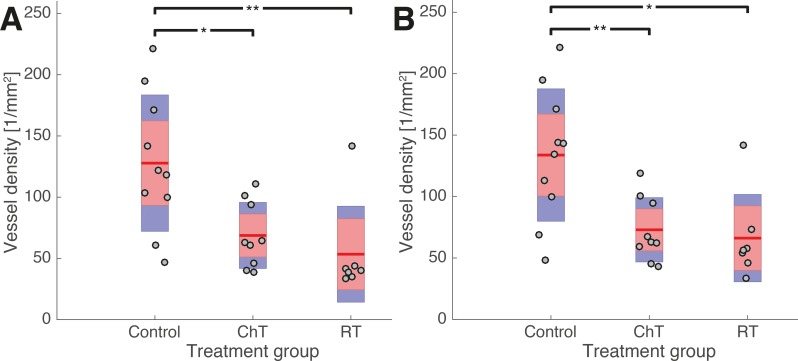
Fig 6. Blood vessel densities in untreated tumors (control group) and tumors that have been treated by cisplatin (ChT) and hypofractionated radiotherapy (RT).
The blood vessel densities are computed with respect to (A) the entire tumor, and (B) only to the viable and homogeneous tumor regions, i.e. excluding areas of necrosis. In both cases, the blood vessel counting was not restricted to certain fields of view but include the whole region under consideration (cf. section B in the S1 Text). The margins of the tumors were excluded from the blood vessel counting due to unspecific staining this region. Each grey dot indicates the vessel density for a single tumor, which had been computed as the arithmetic mean over a number of histological sections (cf. section B of the S1 Text). The arithmetic mean of the entire treatment group (Control, ChT, RT) is shown by a red line. Red boxes indicate one standard deviation of the vessel densities in the respective group. The blue boxes indicate the 95% confidence intervals of the arithmetic mean values. An asterisk represents a significance level of p<0.05, two asterisks denote a significance level of p<0.01.

