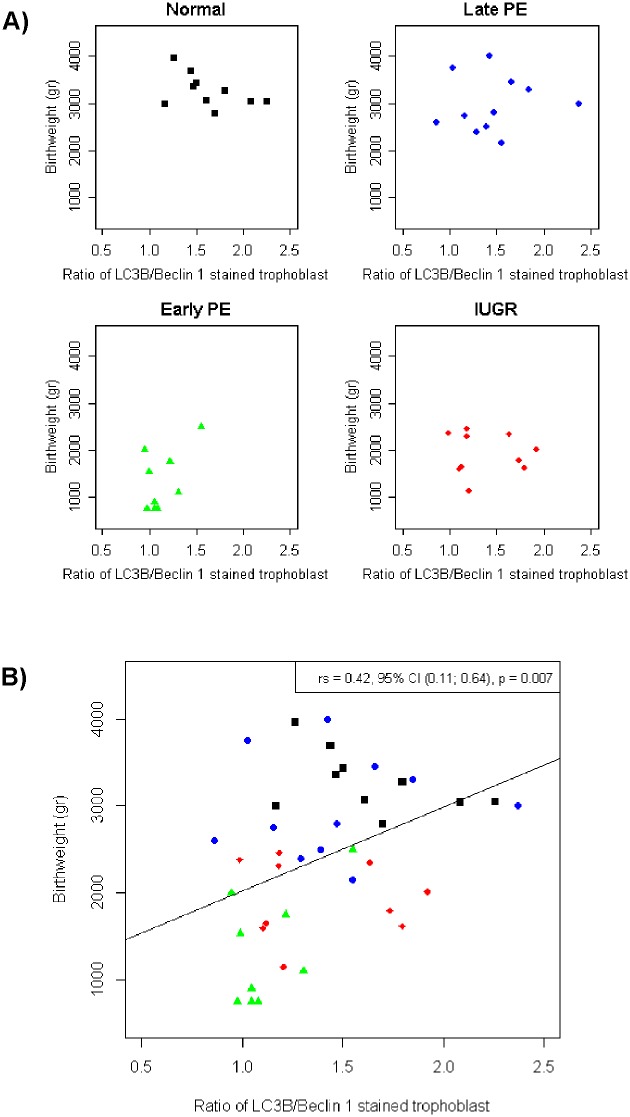
Fig 6. Scatter diagram showing the correlation of autophagy markers with newborns’ birthweight.
(a) The ratio of LC3B/Beclin-1 of stained trophoblast was correlated with the newborns’ birthweight for the four groups separately and (b) comparing all groups in one diagram. There was a significant difference between the four groups (p = 0.007). The early-onset preeclampsia and IUGR groups showed a positive correlation, while the normal pregnant and late-onset preeclampsia groups showed a negative correlation.

