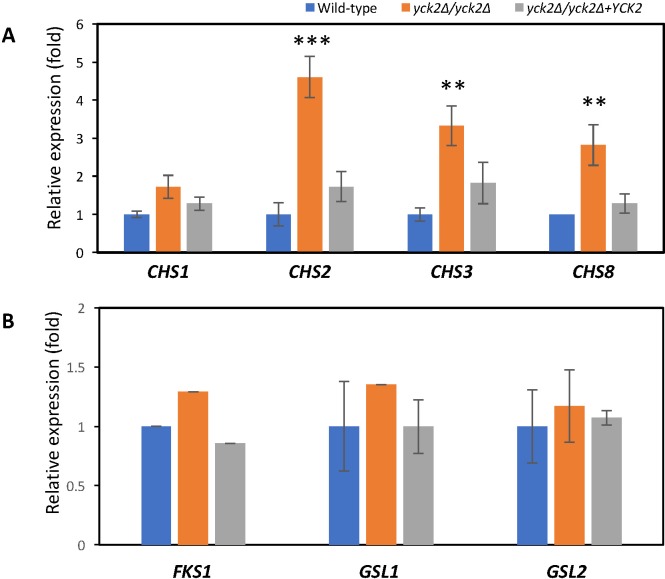
Fig 4. Quantitative gene expression analysis of cell wall synthase genes.
A, the relative mRNA expression of chitin synthase genes compared to wild type in the indicated strains grown in YPD at 30°C to mid log phase (** p<0.001 and *** p<0.0001). B, the relative mRNA expression of glucan synthase genes compared to wild type in the indicated strains grown in YPD at 30°C to mid log phase.

