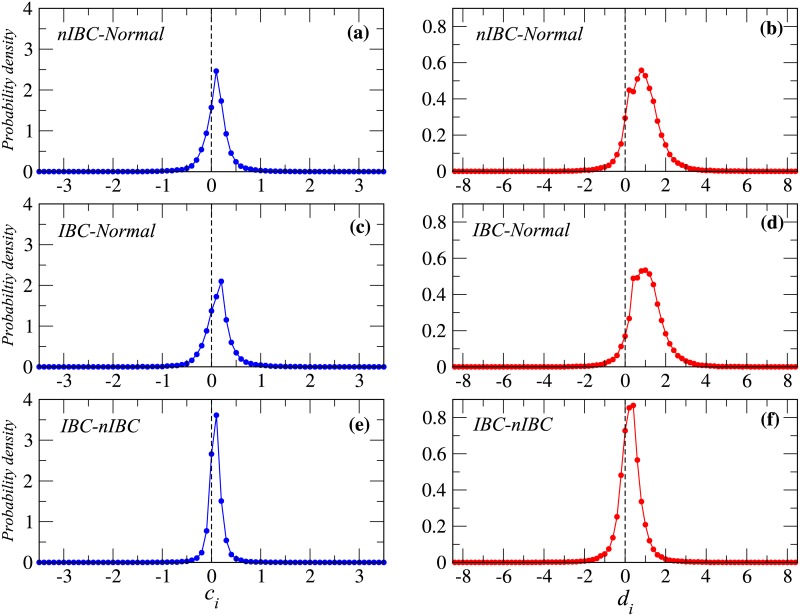
Fig 2. The probability density for the ci (a,c,e) and di (b,d,f) change ratios for all three state pairs.
The results clearly show a displacement of the distribution to the right hand size. This shift is more significant in the case of di change ratio. The disease state pairs are indicated in figure.

