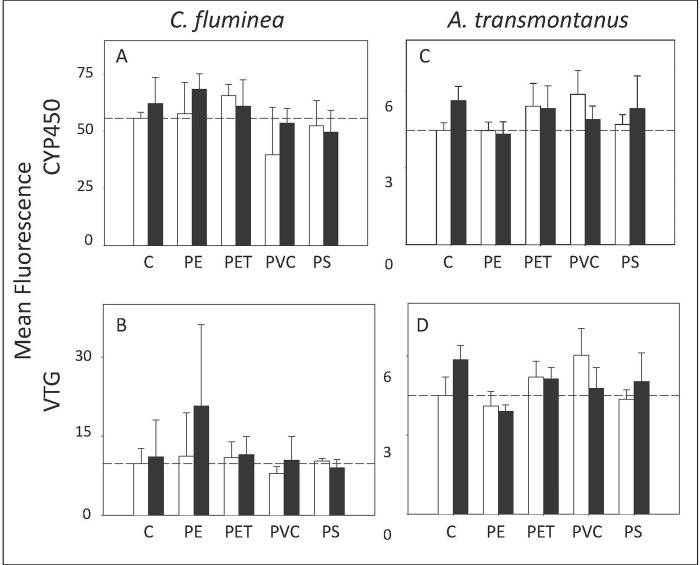
Fig 1. Immunohistochemistry.
CYP450 (top) and vitellogenin (bottom) expression presented as mean fluorescence in clams (C. fluminea) (a, b) and fish (A. transmontanus) (c, d). Dotted lines represent the average value for the negative control treatment. Non-PCB treatments are depicted by white bars and PCB treatments are depicted by black bars (n = 3).

