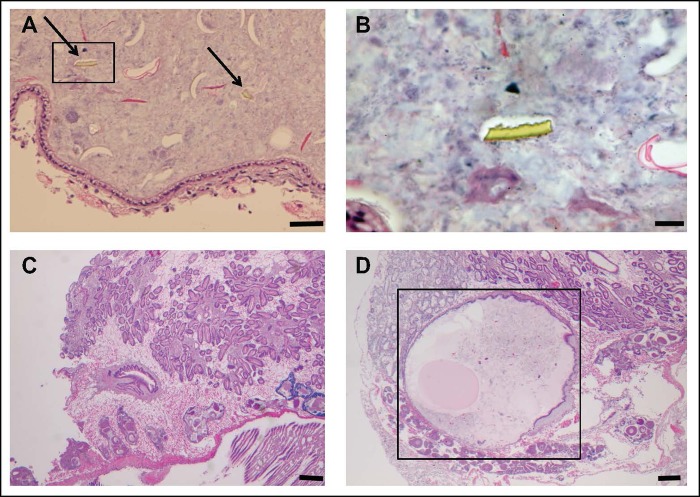
Fig 2. Histopathology sections.
Histopathological sections of C. fluminea after the 28-day dietary exposure. Micrographs on the top show microplastic fragments in the gastrointestinal tract (a, depicted by arrows; scale bar = 50μm) and magnified (b; scale bar = 20μm). Micrographs on the bottom show a clam from the control treatment with a normal stomach (c; scale bar = 200μm) and a clam from the PVC+PCB treatment with a congested stomach and degeneration of the digestive gland (d; outlined in a box; scale bar = 200μm).

