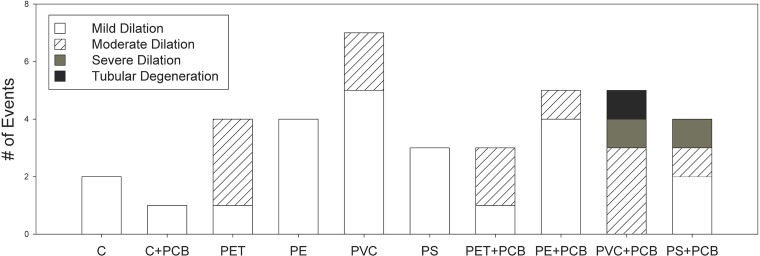
Fig 3. Histopathology abnormalities in clams.
Number of histopathological abnormalities across all individual clams examined from each treatment (n = 9 clams per treatment) after the 28-day exposure. Individual bars represent the number of abnormalities (y axis) per treatment (x axis) and shading represents the type of abnormality: mild tubular dilation (white), moderate tubular dilation (striped), severe tubular dilation (dark grey) and tubular degeneration (black).

