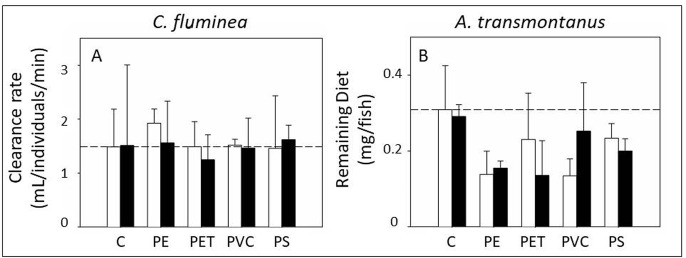
Fig 4. Feeding behavior.
Feeding behavior expressed as clearance rate (mL/individuals/min) in clams (C. fluminea) (a) and remaining diet (mg/fish) in fish (A. transmontanus) (b). Dotted lines represent the average value for the negative control treatment. Non-PCB treatments are depicted by white bars and PCB treatments are depicted by black bars (n = 3).

