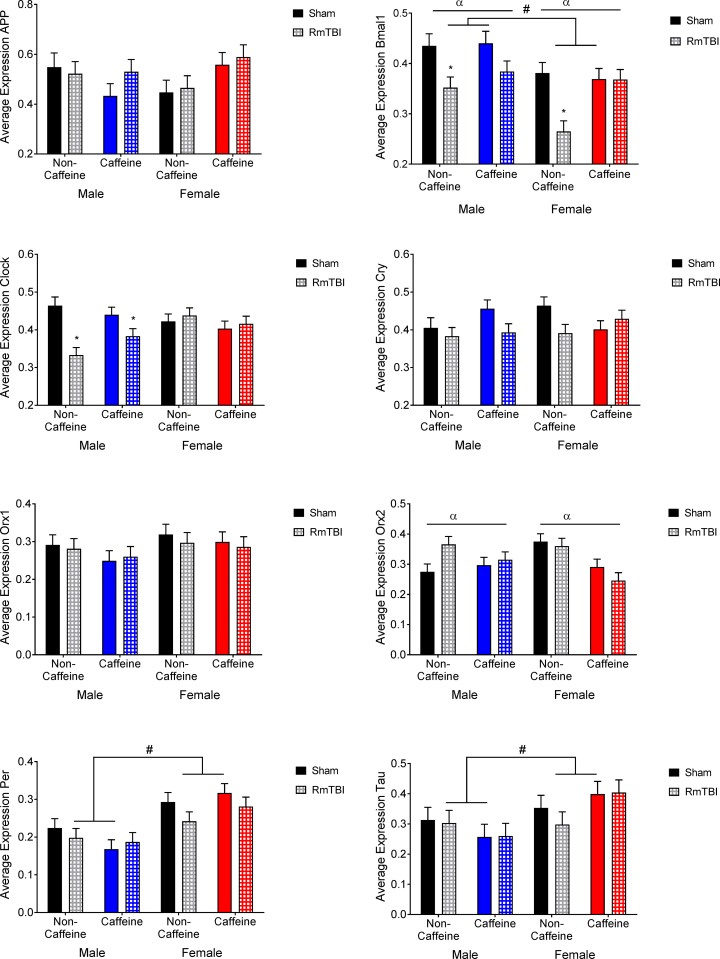
Fig 5. Hypothalamic gene expression in male and female sham and RmTBI groups with or without caffeine in the drinking water.
Mean differences were considered significant at p < .05. (*) indicates a main effect for RmTBI, (α) indicates a main effect for caffeine, and (#) indicates a main effect of sex.

