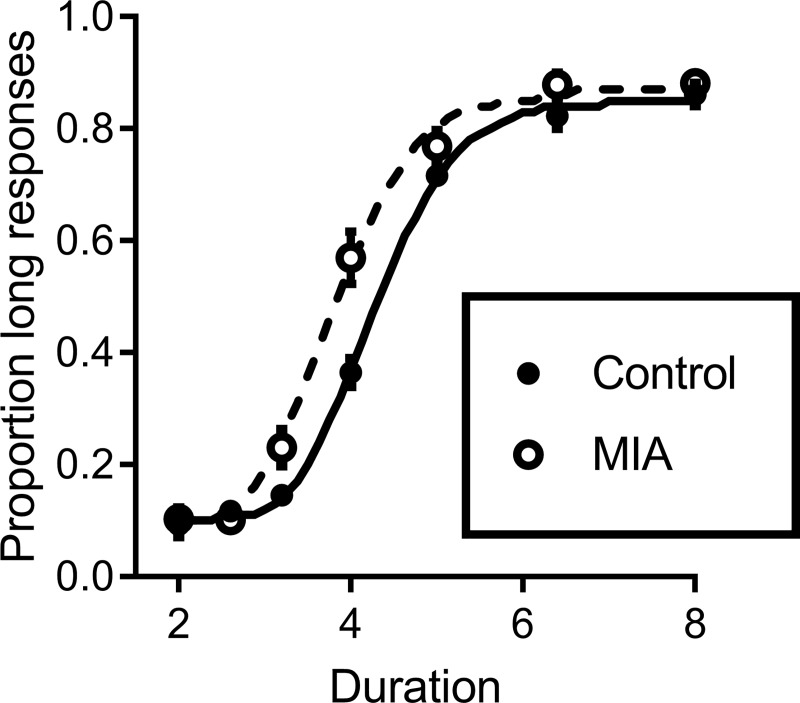
Fig 2. Mean proportion of responses to the lever corresponding to the “long” anchor cue as a function of sample duration for control and MIA rats during the intermediate sample testing phase.
The lines through the data are the best fitting form of Eq 1 to the average proportion-long response data across rats from each group (parameter estimates are based on fits of the model to individual rats). Please note that error bars are subsumed by the data points in some cases.

