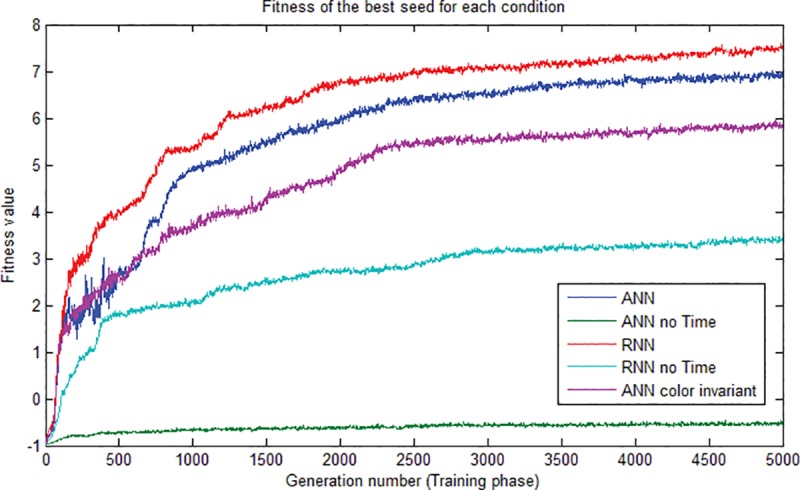
Fig 4. Comparison of the architectures’ fitness functions.

The plot shows the difference in growth of the fitness function of the best individual for each of the conditions during the training phase. Apart from the ANNnoTime condition, the other architectures all scored a fitness above 2.0.
