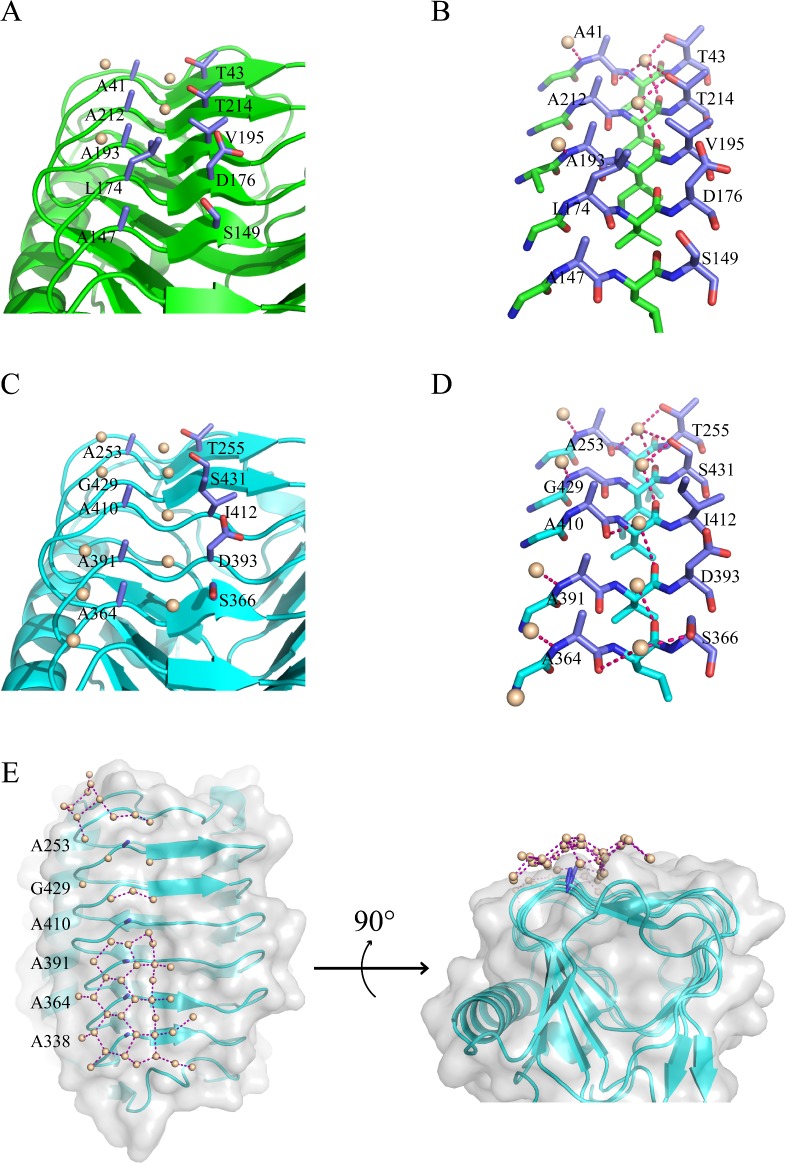
Fig 4. Predicted ice binding sites.
(A) The predicted IBS on domain A. The two rows of aligned side chains are in blue, water molecules in gray. (B) Stick diagram of the IBS of domain A and surrounding water. Each water molecule formed at least one hydrogen bond with protein backbone. (C) The predicted IBS on domain B. The two rows of aligned side chains are in blue, water molecules in gray. One row of well packed water molecules was found between the two rows of aligned side chains. The other row of water is located on the other side of the aligned small side chains. (D) Stick diagram of the IBS of domain B and surrounding water. Each water molecule formed at least one hydrogen bond with protein backbone. (E) Water molecules form pentagonal and hexagonal rings at the IBS on domain B. Overall structure of domain B is displayed as cartoon (cyan). Ala row on the IBS of domain B is illustrated as stick diagram (blue).

