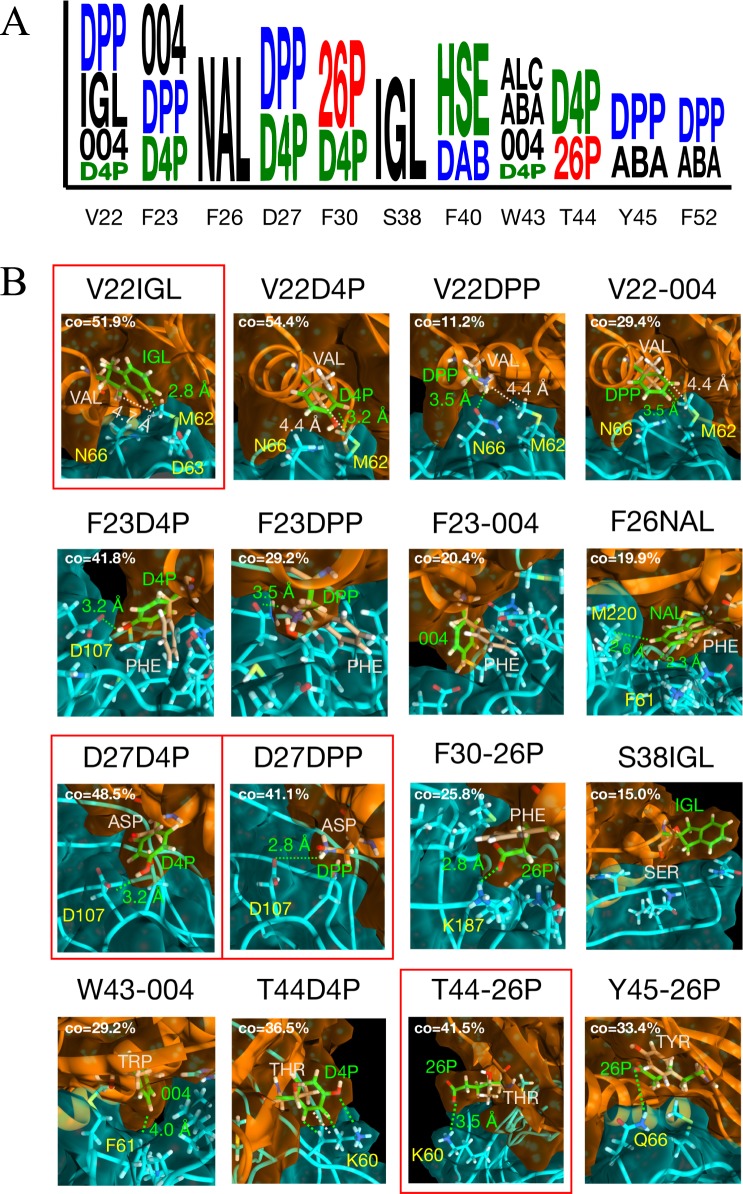
Fig 3. Rosetta energy and structure predictions for VEGF binding using non-canonical amino acids.
A: logo showing the NCAA mutations that produce a lower energy score than the lowest energy CAA at each position. Character size is proportional to the magnitude of change in Rosetta energy score. B: interaction changes yielding improvements for each NCAA that has lower binding energy score than the best CAA. Inhibitor is shown in orange, VEGF is shown in cyan. Original CAAs are coloured beige and NCAA mutations are lime green. Red boxes highlight the most significant energy changes, confirmed by subsequent TI. The dominant conformational state from each simulation is shown (from clustering at the interface). Each dominant cluster occupancy time (CO) is shown as the percentage of total simulation time.

