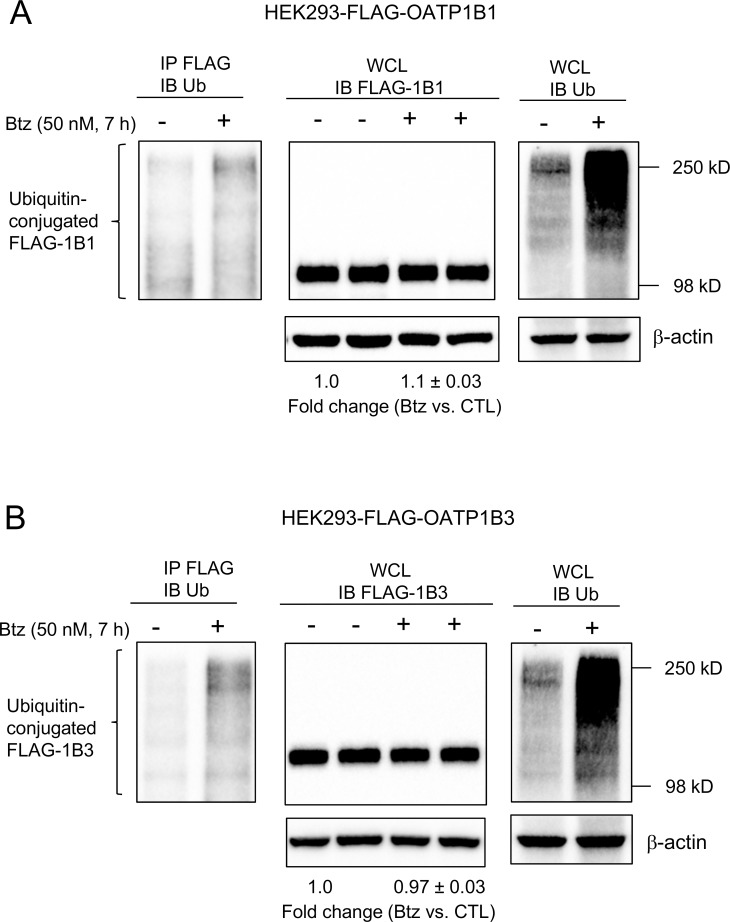
Fig 2. Effects of bortezomib on the ubiquitination and total protein levels of FLAG-OATP1B1 and FLAG-OATP1B3 in HEK293-FLAG-OATP1B1 and HEK293-FLAG-OATP1B3 cell lines.
HEK293-FLAG-OATP1B1 and–FLAG-OATP1B3 stable cell lines were seeded at a density of 3x10⁶ cells per 100-mm2 dish. After culturing for 48 h, cells were treated with bortezomib (Btz) (50 nM, 7 h) or vehicle control (CTL). Whole cell lysates (WCL) (500 μg) from HEK293-FLAG-OATP1B1 (A, left panel) and HEK293-FLAG-OATP1B3 (B, left panel) were subjected to immunoprecipitation (IP) with FLAG antibody, followed by immunoblotting with ubiquitin antibody. Immunoblots of FLAG (A and B, middle panels) and ubiquitin (right panels of A and B) were conducted using whole cell lysates (50 μg) of HEK293-FLAG-OATP1B1 (A) and HEK293-FLAG-OATP1B3 (B) cells treated with bortezomib (50 nM, 7 h) or vehicle control. β-actin served as the loading control. FLAG-OATP1B1 and FLAG-OATP1B3 protein levels determined by densitometry were normalized to levels of β-actin. Fold changes of total protein levels in bortezomib-treated cells vs. CTL were expressed as mean ± SD. Representative images from n = 3 independent experiments are shown.

