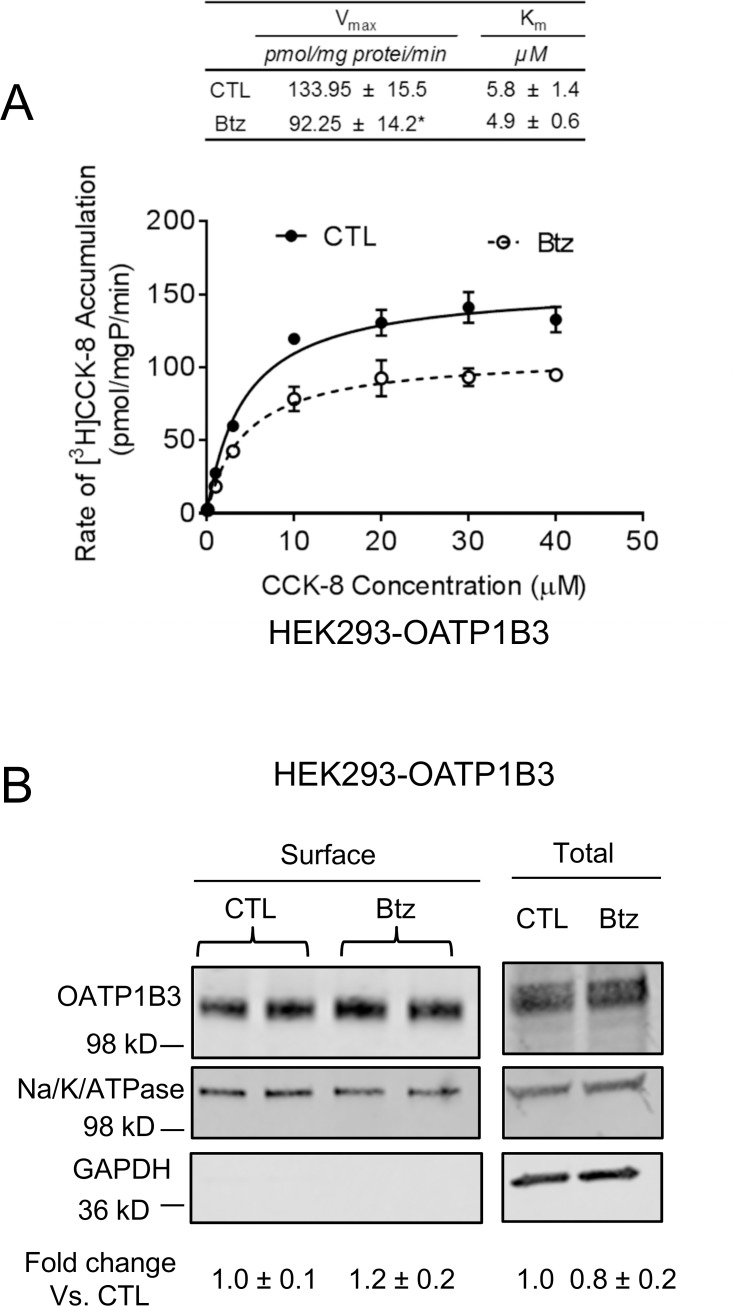
Fig 6. Effects of bortezomib treatment on the transport kinetics of CCK-8 and surface protein levels of OATP1B3 in HEK293-OATP1B3 cells.
HEK293-OATP1B3 cells were seeded at a density of 1.2 x 10⁵ cells/well in 24-well plates, and were cultured for 48 h prior to performing the experiment. (A) The concentration-dependent accumulation of CCK-8 (0.1–40 μM, 3 min) was determined in HEK293-OATP1B3 cells pretreated with control (CTL) or bortezomib (Btz) (50 nM, 7 h). Solid and dashed lines represent the best fit lines of the Michaelis–Menten equation to the data of vehicle control (CTL) (closed circles) and bortezomib (Btz) pretreatment (open circles), respectively. A representative graph of three independent experiments performed in triplicate is shown. The student’s t-test was conducted to compare the Vmax and Km values between bortezomib and vehicle control pretreatment. * indicates a statistically significant difference (p<0.05; bortezomib vs. CTL). (B) HEK293-OATP1B3 cells were pretreated with 50 nM bortezomib (Btz) or vehicle control (CTL) for 7 h. Surface levels of OATP1B3 were determined via biotinylation, followed by immunoblotting with OATP1B3 and Na-K-ATPase antibodies. GAPDH was used as a cytoplasmic protein marker. OATP1B3 surface protein levels were determined by densitometry and were normalized to those of Na-K-ATPase. Fold changes in the surface levels of OATP1B3 (bortezomib vs. CTL) were expressed as mean ± SD of three independent experiments.

