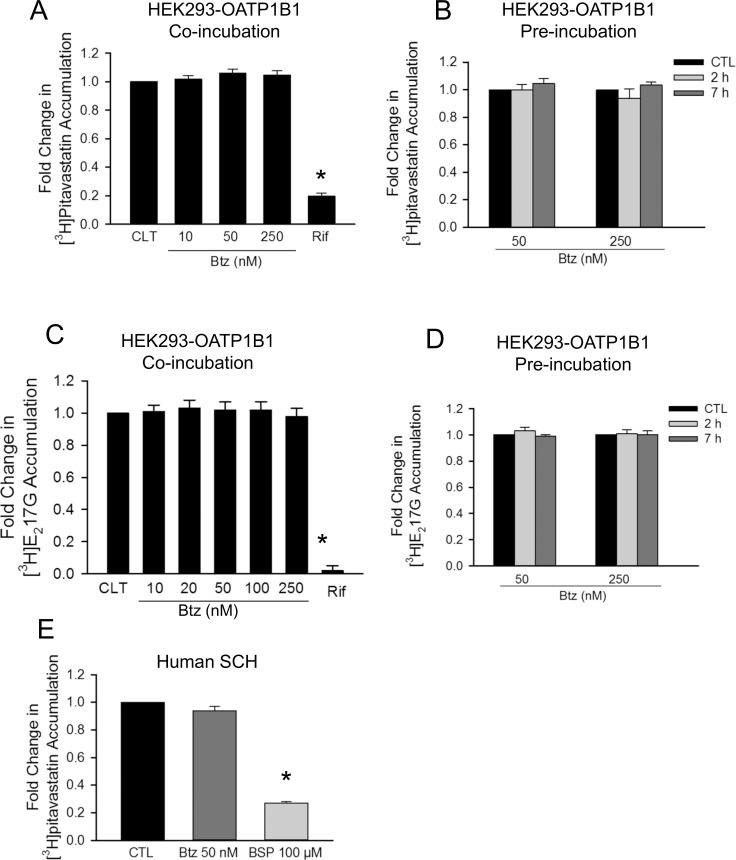
Fig 7. Effects of bortezomib on OATP1B1-mediated [3H]pitavastatin and [3H]E217βG transport in HEK293-OATP1B1 cells and on [3H]pitavastatin accumulation in human SCH.
HEK293-OATP1B1 cells were seeded at a density of 1.2 x 10⁵ cells/well in a 24-well plate and were cultured to confluence. Human SCH were cultured as described in the “Materials and Methods”. (A) Model-estimated fold change and associated SE in [3H]pitavastatin accumulation (1 μM, 0.5 min) in the presence of 10–250 nM bortezomib (Btz) or 25 μM rifampicin (Rif) vs. vehicle control (CTL) in HEK293-OATP1B1 cells (Co-incubation). (B) Model-estimated fold change and associated SE in [3H]pitavastatin accumulation (1 μM, 0.5 min) in HEK293-OATP1B1 cells pretreated with bortezomib (Btz) vs. vehicle control (CTL) at each indicated time and concentration (Pre-incubation). Following pretreatment, cells were washed three times with HBSS buffer, and the [3H]pitavastatin accumulation was determined in the absence of bortezomib. (C) Model-estimated fold change and associated SE in [3H]E217βG accumulation in the presence of 10–250 nM bortezomib (Btz) or 25 μM rifampicin (Rif) vs. vehicle CTL in HEK293-OATP1B1 cells (Co-incubation). (D) Model-estimated fold change and associated SE in [3H]E217βG accumulation (1 μM, 2 min) vs. vehicle CTL treatment in HEK293-OATP1B1 cells pretreated with bortezomib (Btz) for the indicated times and at the indicated concentrations (Pre-incubation). Following pretreatment, cells were washed three times with HBSS buffer, and the [3H]E217βG accumulation was determined in the absence of bortezomib. (E) Model-estimated fold change and associated SE of [3H]pitavastatin accumulation (1 μM, 0.5 min) in human SCH pre-incubated with bortezomib (50 nM for 7 h) or co-incubated with positive control bromosulfophthalein (BSP) (100 μM) vs. vehicle CTL. Fold changes and SEs were estimated by linear mixed effects models, as described in the “Data Analysis” section (n = 3 hepatocyte donors in triplicate). To account for multiple comparisons, p-values were adjusted based on the Bonferroni method. * indicates a statistically significant difference (adjusted p<0.05) vs. CTL.

