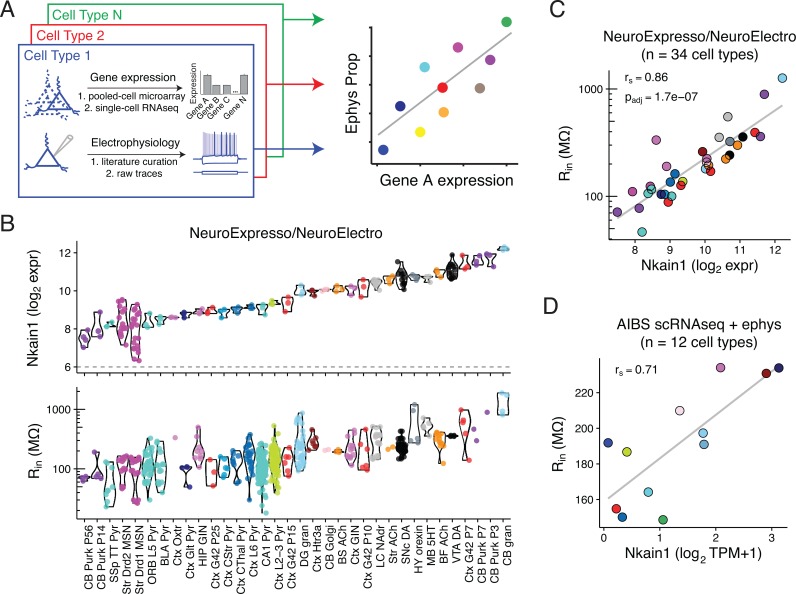
Fig 1. Correlating cell type-specific gene expression with electrophysiological diversity.
A) Illustration of transcriptomic and ephys data compilation by cell type (left) and correlation analysis of single gene expression by ephys parameter diversity (right). B) Top row: Gene expression levels of Nkain1 across 34 neuron types sampled from the combined NeuroExpresso/NeuroElectro dataset. Each dot reflects a unique transcriptomic sample collected from purified cells and y-axis is in units of log2 expression (i.e., each increment reflects a 2-fold change in expression level). Dashed line at 6 indicates approximate level of background expression. Bottom row: Input resistance values for the same cell types in top row. Individual dots reflect population mean electrophysiological values manually curated from individual articles represented in the NeuroElectro database, following experimental condition normalization. C) Same data as in B, but data has been summarized by the mean (expression, x-axis) or median (ephys, y-axis) value within each cell type. rs indicates Spearman rank correlation and padj indicates Benjamini Hochberg false discovery rate. Note that cell types with high Rin, such as cerebellar granule cells and midbrain dopaminergic cells, express high levels of Nkain1 whereas cell types with low Rin, including neocortical and hippocampal pyramidal cells, express low levels of Nkain1. D) Corresponding summary data from the Allen Institute for Brain Science (AIBS) Cell Types dataset. Dots reflect averaged values from 12 individual mouse cre-lines and are detailed in Table 2. Expression values are based on single-cell RNAseq (scRNAseq), quantified as Transcripts Per Million (TPM). Ephys values are based on single-cell characterization in vitro.

