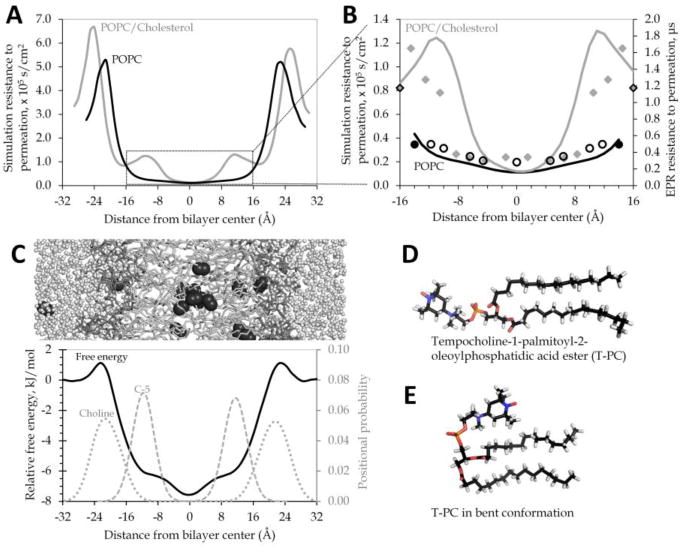
Fig.1. EPR “headgroup” probe may oversample the phospholipid tail region.

(A) Simulation resistance to permeation gives a similar area under the curve for POPC (black) and POPC/cholesterol (gray). (B) The same simulation resistance to permeation curves (solid lines) differ substantially in contour and area under the curve in the region most thoroughly sampled in published EPR measurements. The secondary axis shows the EPR resistance to permeation values [9], placing the probes according to center of the probability distributions observed in our simulations for the corresponding atoms (oleoyl tail carbons 5, 7, 9, 10, 12, 14, and 16 in open black circles for POPC or solid gray diamonds for POPC/cholesterol; probability distribution data not shown). The T-PC probe positions (solid black circles for POPC or black-outlined diamonds for POPC/cholesterol) have also been estimated from simulations of POPC with one T-PC molecule in each bilayer leaflet. (C) Cropped image of POPC/water/O2 simulation system, positioned above a relative free energy profile for oxygen across a POPC bilayer system at 37°C. Relative local free energy for O2 at 37°C across a model POPC bilayer shows peaks in the headgroup regions and a free energy minimum in the tail region. Positional probability distributions are shown for the POPC headgroup choline (dotted line) and for the fifth carbon of the POPC oleoyl tail (C-5, dashed line). (D–E) Two alternate conformations of the EPR T-PC probe molecule, with the bent conformation favored in preliminary simulations at 25°C.
