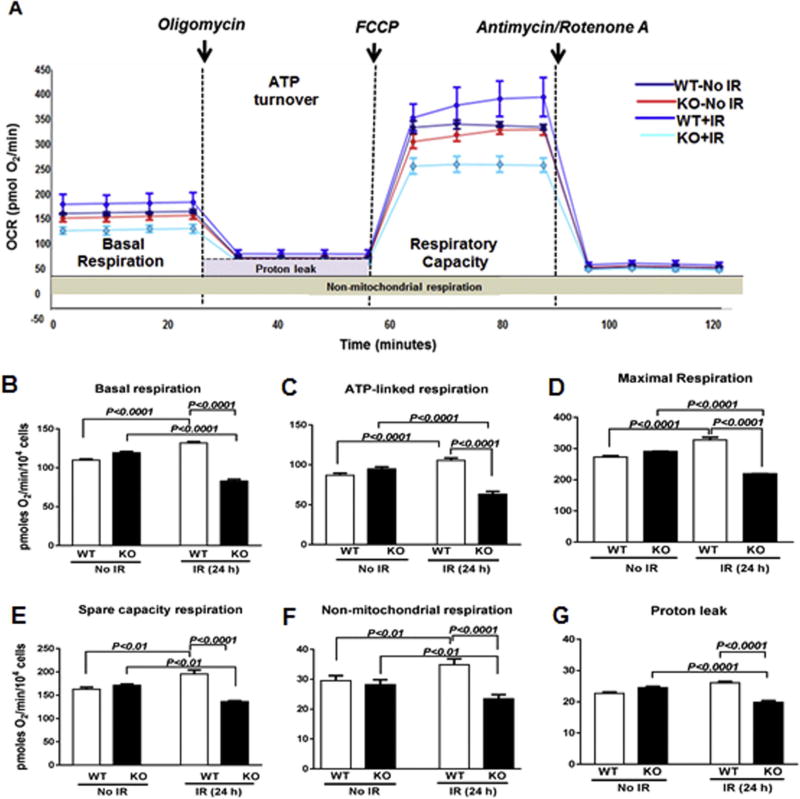
Fig. 4. Cebpd-KO MEFs showed decrease in mitochondrial bioenergetics after IR exposure.
(A) Mitochondrial bioenergetics profiles were measured by seahorse XF-analyzer in sham and irradiated WT and KO MEFs. The arrows indicate the time of addition of mitochondrial inhibitors: oligomycin (1 µm), FCCP (5 µm) or rotenone and antimycin A (10 µm). (B) basal respiration; (C) ATP-dependent respiration; (D) Maximal respiration rate; (E) Reserved respiratory capacity; (F) non-mitochondrial respiration and (G) proton leakage between WT and KO MEFs. The data are presented as average ± S.E.M. of n = 4–8 wells per treatment group.

