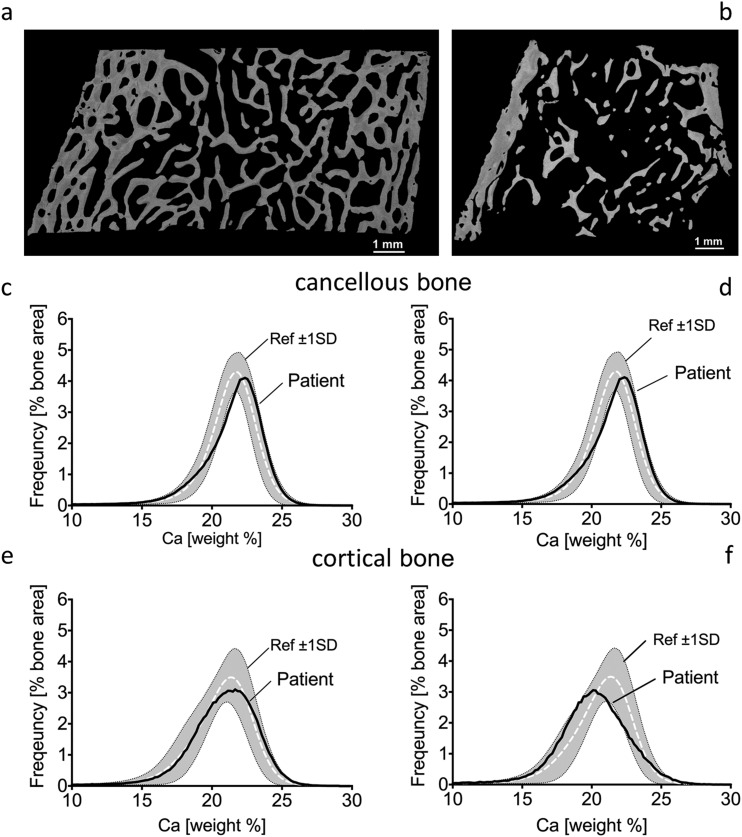
Figure 2.
Quantitative backscattered images depicting cortical dimensions and trabecular network (a, b) and BMDD histograms of cancellous (c, d) and cortical (e, f) bone from transiliac biopsy samples of patients 3 (left) and 5 (right). BMDD results of cancellous and cortical bone are compared with reference BMDD from healthy children (gray band) (26). The corresponding parameters are given in Table 2. Ca, calcium; ref, reference; SD, standard deviation.

