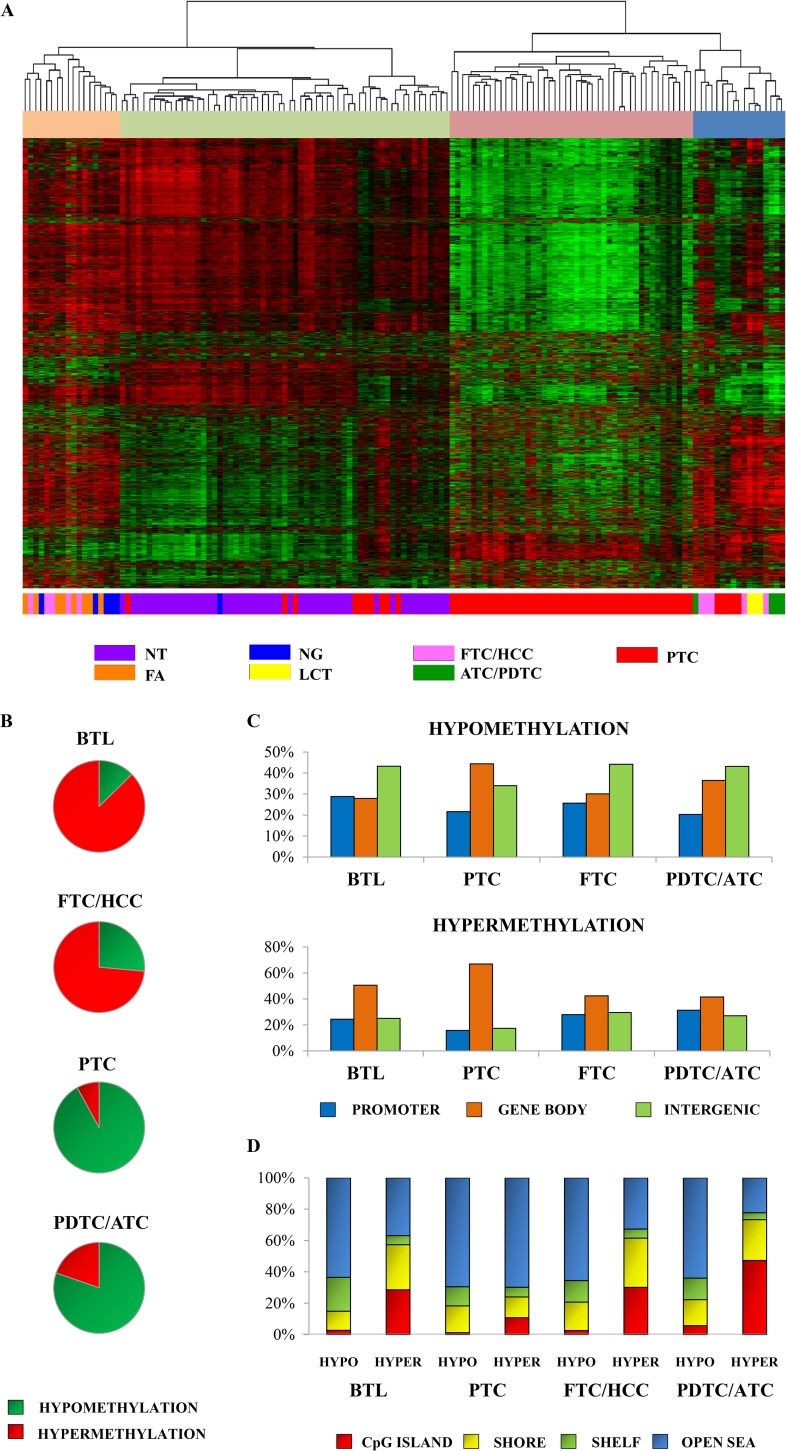
Figure 1.
Comparison of CpG site methylation regions between benign lesions, TCs, and surrounding NTs. (A) Unsupervised hierarchical clustering analysis of the methylation profiles of thyroid tissues using the most variable probes within the platform (8016 probes). Four major groups were detected and defined by the most variable probes. The rows indicate the CpG sites, and the columns indicate the samples. (B) Percentage of hypermethylated (red) and hypomethylated (green) probes in BTL, PTC, FTC/HCC, and PDTC/ATC. (C) CpG site proportions by location relative to promoter, gene body, and intergenic region, according to Illumina 450 K annotation. (D) CpG site proportions by location relative to CpG island regions, according to Illumina 450 K annotation.

