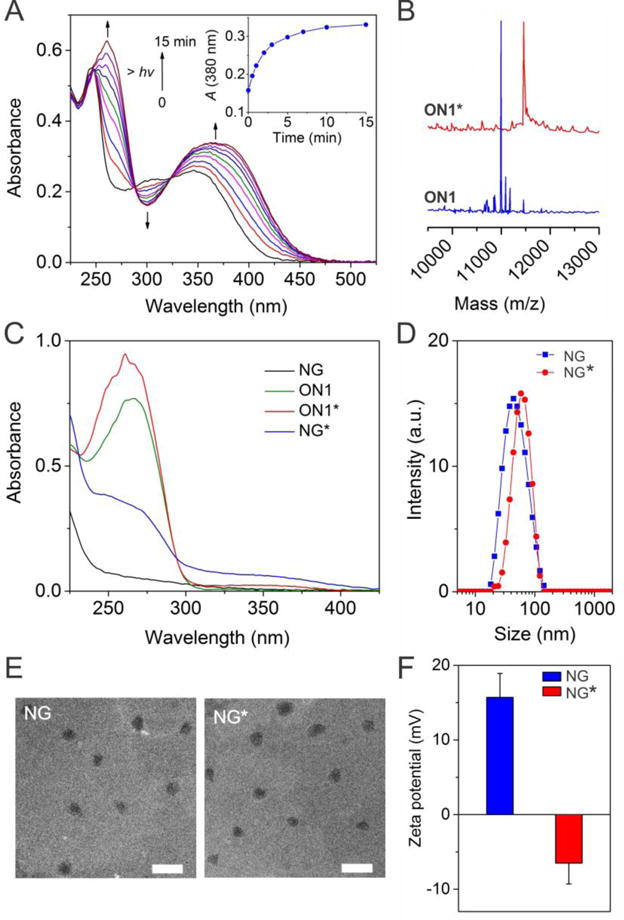
Figure 3.

Synthesis and characterizations of NG*. (A) UV-vis absorption spectra monitoring of the photolysis of linker 5 in PBS solution upon UV irradiation (365 nm, 3 mW·cm−2). Inset figure shows the irradiation dependent absorbance change of the solution monitored at 380 nm. (B) Characterization of ON1 before and ON1* using MALDI-TOF analysis. (C) UV-vis absorption spectra of ON1, ON1*, NG and NG* in PBS solution. (D) DLS analysis of NG and NG*. (E) TEM images of NG and NG*. Scale bar: 250 nm. (F) Zeta-potential of NG and NG*. Error bars represent s. e. m (n = 3).
