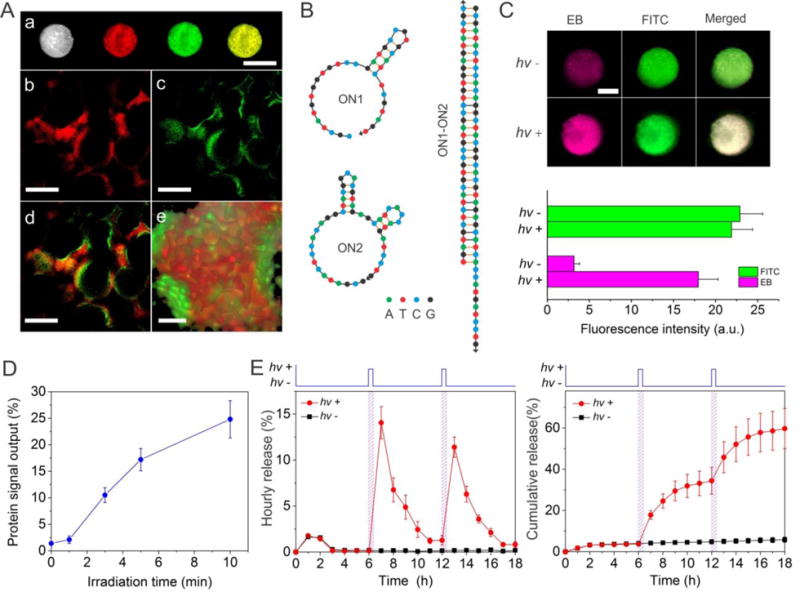
Figure 5.

Examination of biomimetic signal output for protein release mediated by sequential photoreaction and hybridization. (A) Images of the hydrogel system. (a): Bright field and fluorescence images of the system loaded with NG* examined at the macroscopic level. Scale bar: 2 mm. (b–e): Confocal fluorescence images. (b): ON2 in the bulk hydrogel was stained with TYE665-CS (red). (c): The nanogel was doped with FITC (green). (d): Merged image of b and c. (e): Z-stack imaging of the system under high magnification. Scale bar: 250 μm for b–d, 50 μm for e. (B) Secondary structures of ON1, ON2 and their duplex as analyzed using the software from IDT (http://www.idtdna.com/calc/analyzer). (C) Fluorescence images of the system before and after photoirradiation. Pink: ethidium bromide (EB); Green: FITC. Scale bar: 2 mm. The values of EB and FITC intensity are also quantitatively shown in the bottom graph for clear comparison. (D) Irradiation time dependent protein signal output from hydrogel system. (E) Measurement of hourly (left) and cumulative (right) protein release when the system was photo-irradiated. The duration of photoirradiation was 5 min. The systems were exposed to UV light at 6 and 12 hours, respectively.
