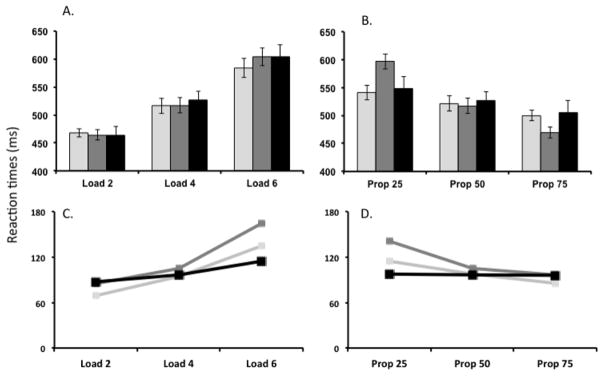
Figure 4.
(A–B) Mean reaction times computed for the DNF model (Model 1 shown in light grey and Model 2 shown in dark grey) and behavioral data (shown in black) for the manipulation of the (A) Load and (B) Proportion. (C–D) Mean standard deviations of reaction times across simulations for the (Model 1 shown in light grey and Model 2 shown in dark grey) and behavioral data (shown in black) for the manipulation of (C) Load and (D) Proportion.

