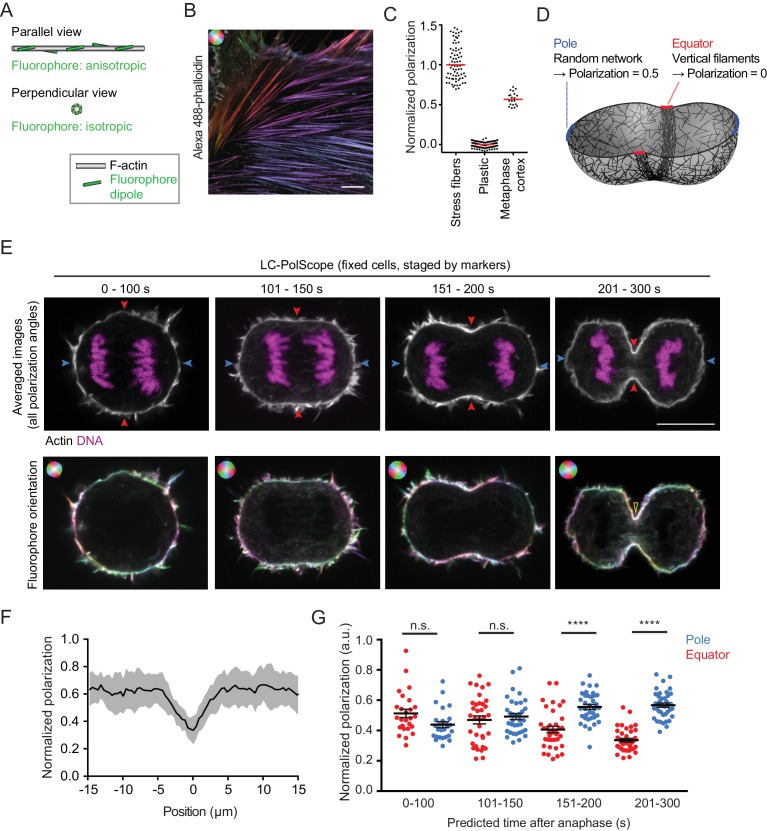
Figure 1. Cleavage furrow ingression initiates by contraction of a randomly oriented actin filament network, which subsequently gradually aligns at the cell equator.
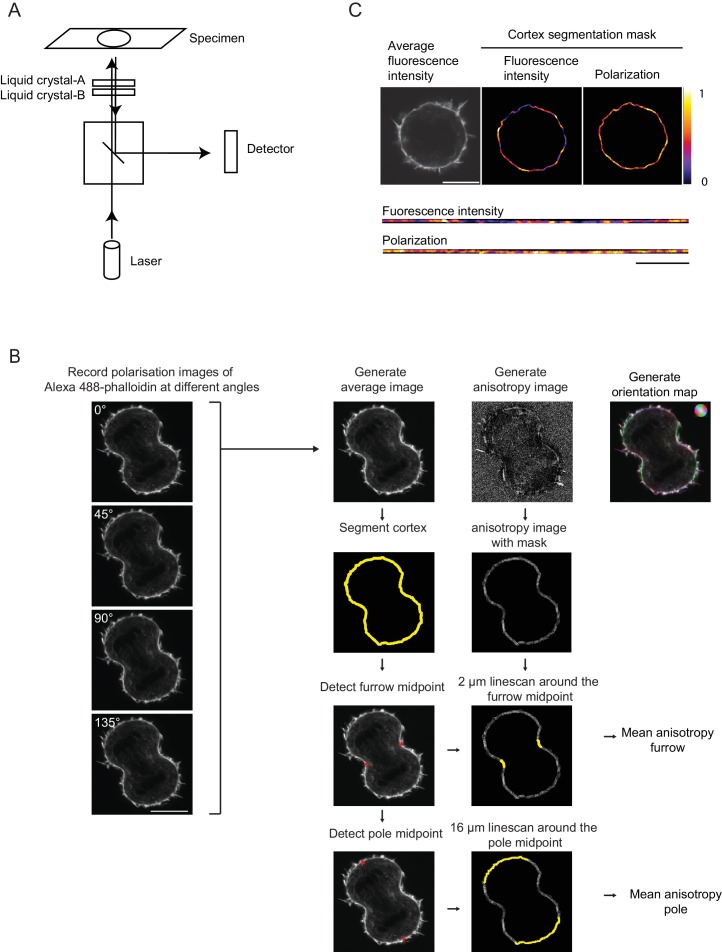
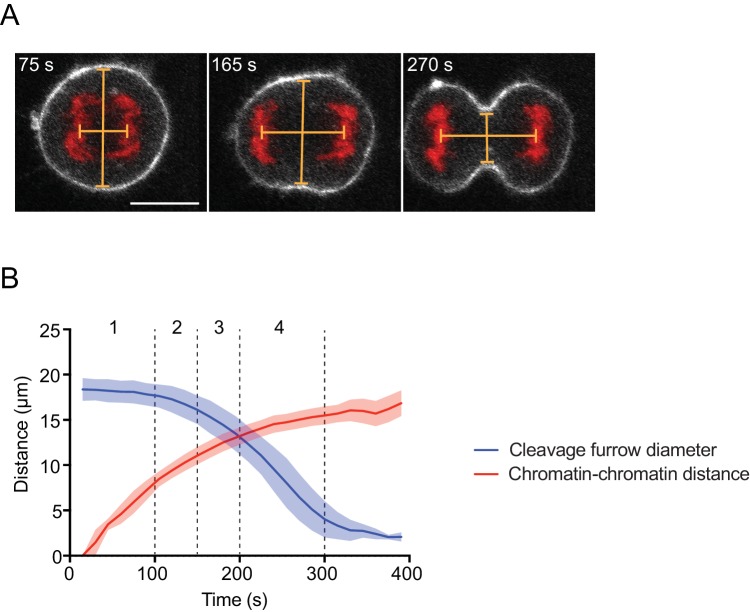
(A) Schematics of actin filament (grey) and fluorescent dipole orientation (green) relative to the optical section of the microscope. Upper panel shows actin filament parallel to the focal plane of the microscope, lower panel shows an actin filament that is perpendicularly oriented to the focal plane of the microscope. On perpendicularly oriented actin filaments, fluorescent dipoles are oriented point symmetrically in every direction and the ensemble of molecules therefore does not yield a fluorescence anisotropy signal. (B) Fluorescence polarization microscopy of stress fibers in fixed interphase hTERT-RPE-1 cells labeled with Alexa Fluor 488-phalloidin using the LC-PolScope. Color saturation indicates degree of fluorophore alignment (anisotropy), hue indicates mean orientation of fluorescence dipoles as shown in upper left corner. (C) Quantification of polarization normalized to calibration samples: stress fibers as in (B) and fluorescent plastic with random fluorescence dipole orientation. Dots indicate individual measurements, bars indicate median. (D) Geometry and normalized polarization predicted by canonical purse-string model of cytokinesis at the equator (red) or cell poles (blue). (E) Images of Alexa Fluor 488-phalloidin-stained hTERT-RPE-1 cells at representative stages during cytokinesis. Blue and red arrows indicate polar and equatorial positions of quantification regions, respectively (upper panel). Lower panel shows the orientation map of the fluorescent dipole as calculated by the different orientations. Color saturation indicates degree of fluorophore alignment (anisotropy), hue indicates mean orientation of fluorescence dipoles as shown in upper left corner. Yellow arrowhead indicates edge of cleavage furrow. (F) Lateral distribution of polarization factor measured along the cell cortex in central sections of late furrow ingression-stage cells, aligned for the cleavage furrow edge as in (E). Line indicates median, shaded area indicates s.d. of 22 cells. (G) Quantification of normalized polarization as indicated in (E). Dots indicate individual cells (n = 136, mean + s.e.m. of both measurements at opposing cortical cell regions; ****p<0.0001 by Kolmogorov-Smirnov test). Scale bars = 10 µm.


