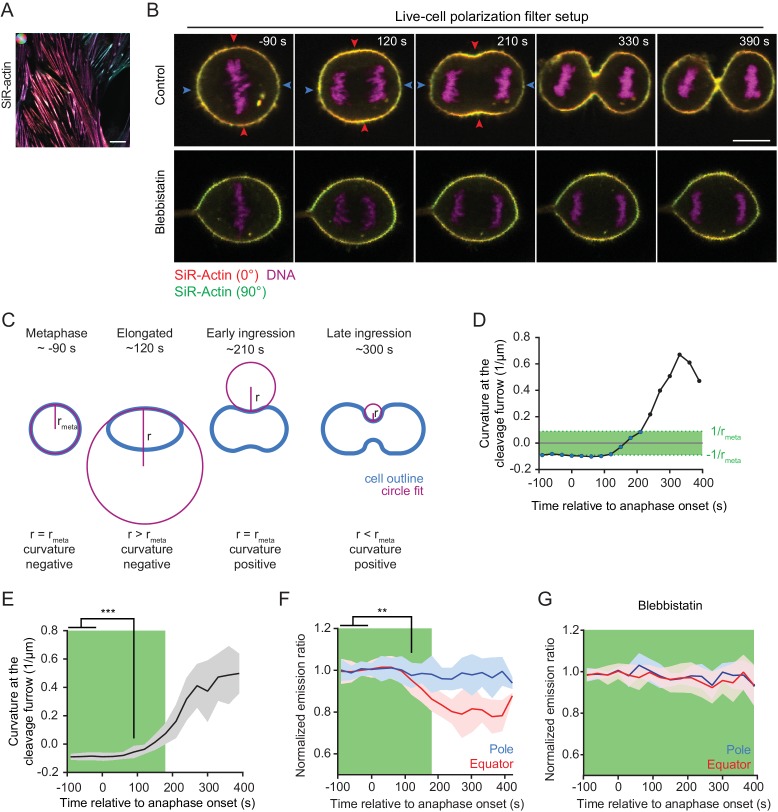
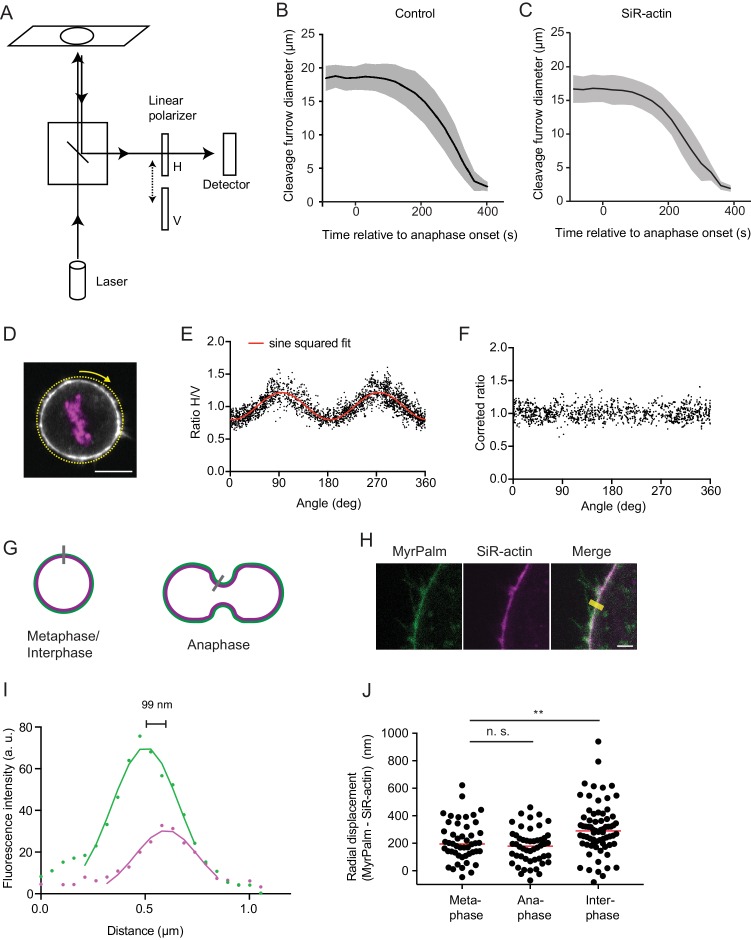
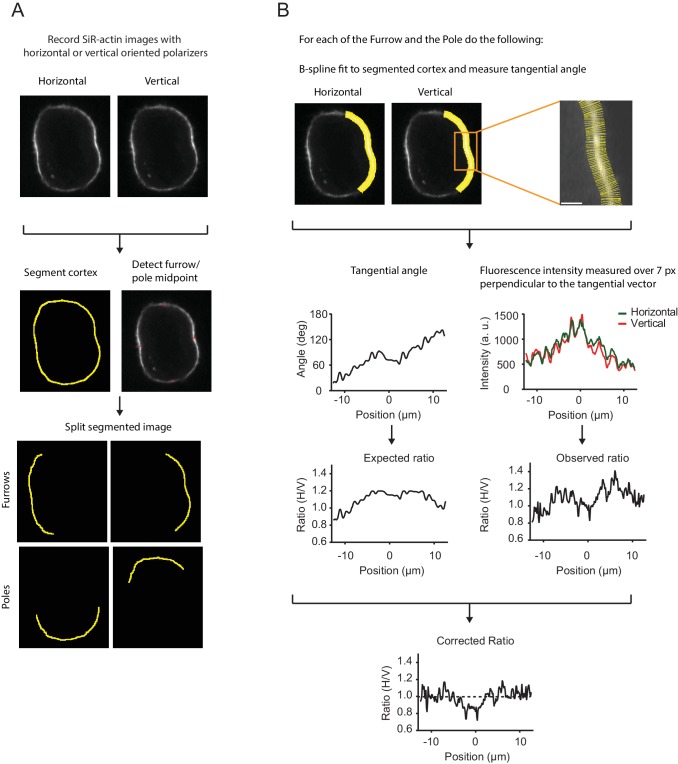
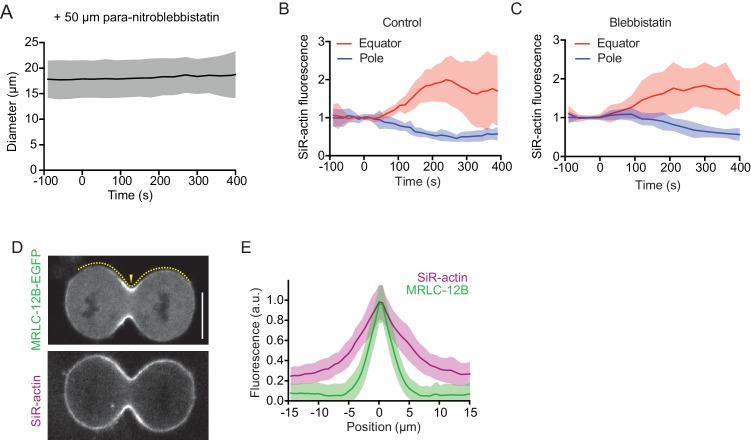
Figure 2. Quantification of actin reorganization by live-cell confocal polarization microscopy.
(A) Fluorescence polarization microscopy of stress fibers in live interphase hTERT-RPE-1 cells labeled with SiR-actin using the LC-PolScope. Color saturation indicates degree of fluorophore alignment (anisotropy), hue indicates mean orientation of fluorescence dipoles as shown in upper left corner. (B) Fluorescence polarization microscopy of live hTERT-RPE-1 cells stably expressing H2B-mRFP (magenta), stained with SiR-actin (overlay of red and green) at representative stages during cytokinesis. Images were acquired with horizontal (red) and vertical (green) linear polarizers in the emission beam path. Untreated cells (upper panel) and cells treated with 50 µm para-nitroblebbistatin (lower panel) are shown. (C) Schematic drawing of the circular fit procedure during cell division. Circles (magenta) were fitted to the center of the equator (blue). (D) Curvature of the equatorial cell cortex in a representative cell. Dots indicate individual time points. Time = 0 s at anaphase onset. (E) Quantification of equatorial cortex curvature in 18 dividing cells. Line indicates mean, gray area s.d.. The first time point with significantly changed curvature was detected at 90 s after anaphase onset by two-tailed t-test; ***p<0.001. (F) Quantification of SiR-actin normalized emission ratio in the 18 dividing cells used for the analysis in (E) (line indicates mean, blue and red areas s.d. **p<0.01 by two-tailed t-test (G) Quantification of SiR-actin normalized emission ratio in dividing cells treated with 50 µm para-nitroblebbistatin. Time = 0 s at anaphase onset (lines indicate median, shaded areas indicate s.d.; equatorial measurement: n = 15 cells, polar: n = 11 cells). (D-G) The green area indicates time points where the absolute value of cortical curvature was equal or below that of the metaphase cell. Only these time points were used for further interpretation of fluorescence anisotropy measurements, to avoid potential artifacts by geometry effects. Scale bars = 10 µm.


