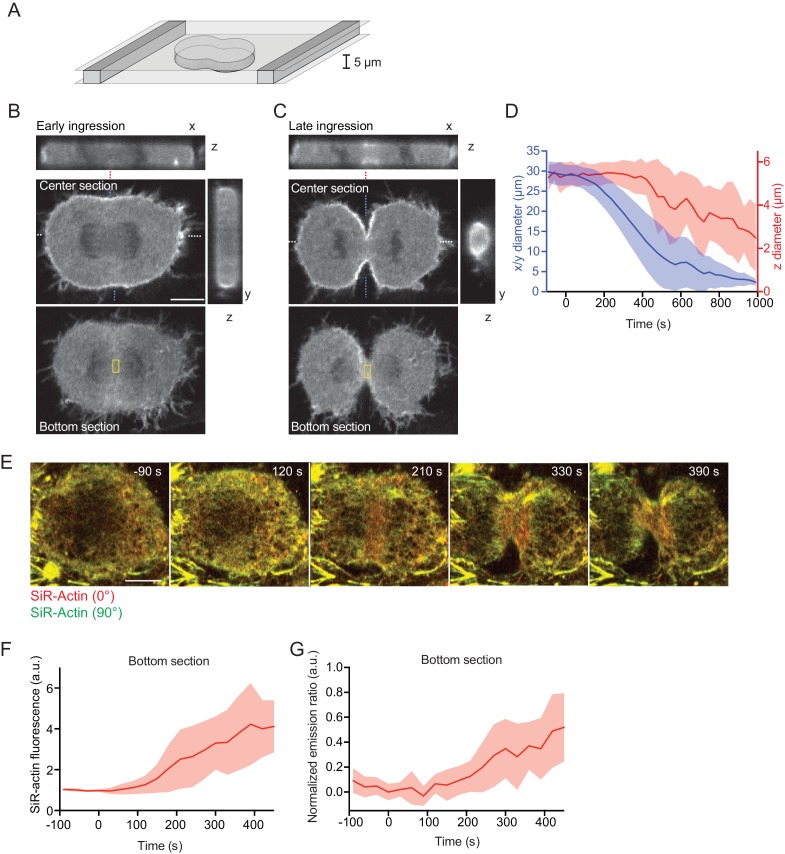
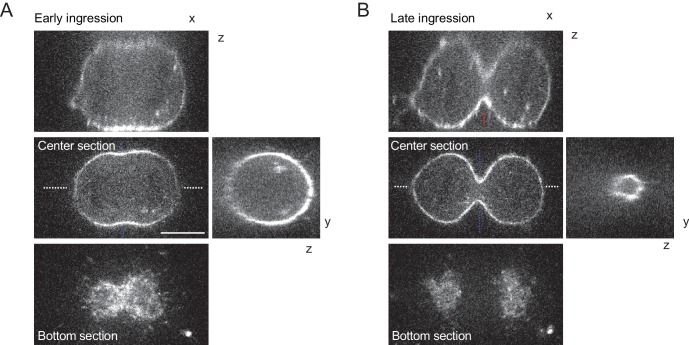
Figure 3. Equatorial actin filaments align on planar surfaces of confined cells.
(A) Schematics of cell confinement chamber used to enforce flat geometry of top- and bottom cell cortex during cytokinesis. (B, C) Confocal 3-D images of live hTERT-RPE-1 cells stably expressing LifeAct-mCherry at (B) early or (C) late furrow ingression stages. The x/z and y/z sections are at positions as indicated by blue or white dashed lines, respectively. Dashed red lines indicate measurement region for furrow ingression along z. Yellow boxes indicate measurement regions for (F, G). (D) Quantification of cleavage furrow ingression in confined cells as in (A–C) along x/y and z directions. Lines indicate median, shaded areas s.d. of n = 14 cells. (E) Fluorescence polarization microscopy of the bottom section of live hTERT-RPE-1 cell stably expressing H2B-mRFP, stained with SiR-actin under confinement. Images were acquired with horizontal (red) and vertical (green) linear polarizers in the emission beam path. (F) Quantification of SiR-actin fluorescence intensity at the cell equator at the bottom surface of confined cells. (G) Quantification of SiR-actin normalized emission ratio at the cell equator at the bottom surface of confined cells. Lines indicate median, shaded areas s.d. of n = 10 cells. Scale bars = 10 µm.


