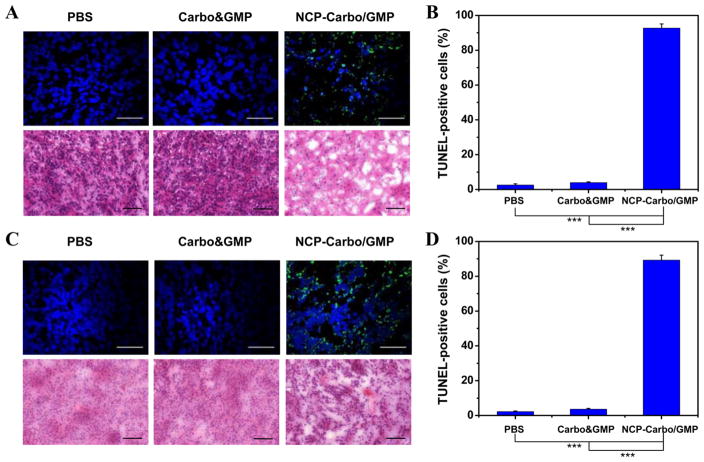
Figure 6.
(A) Representative CLSM images of TUNEL assays and H&E staining of SKOV-3 tumor tissues. DNA fragment in apoptotic cells was stained with fluorescein-conjugated deoxynucleotides (green), and the nuclei were stained with DAPI (blue). Top bar = 50 μm. Bottom bar = 100 μm. (B) The percentages of TUNEL-positive cells in SKOV-3 tumor tissues. (C) Representative CLSM images of TUNEL assays and H&E staining of A2780/CDDP tumor tissues. DNA fragment in apoptotic cells was stained with fluorescein-conjugated deoxynucleotides (green), and the nuclei were stained with DAPI (blue). Top bar = 50 μm. Bottom bar = 100 μm. (D) The percentages of TUNEL-positive cells in A2780/CDDP tumor tissues. Data are expressed as means ± SD (n = 3), ***p < 0.001.

