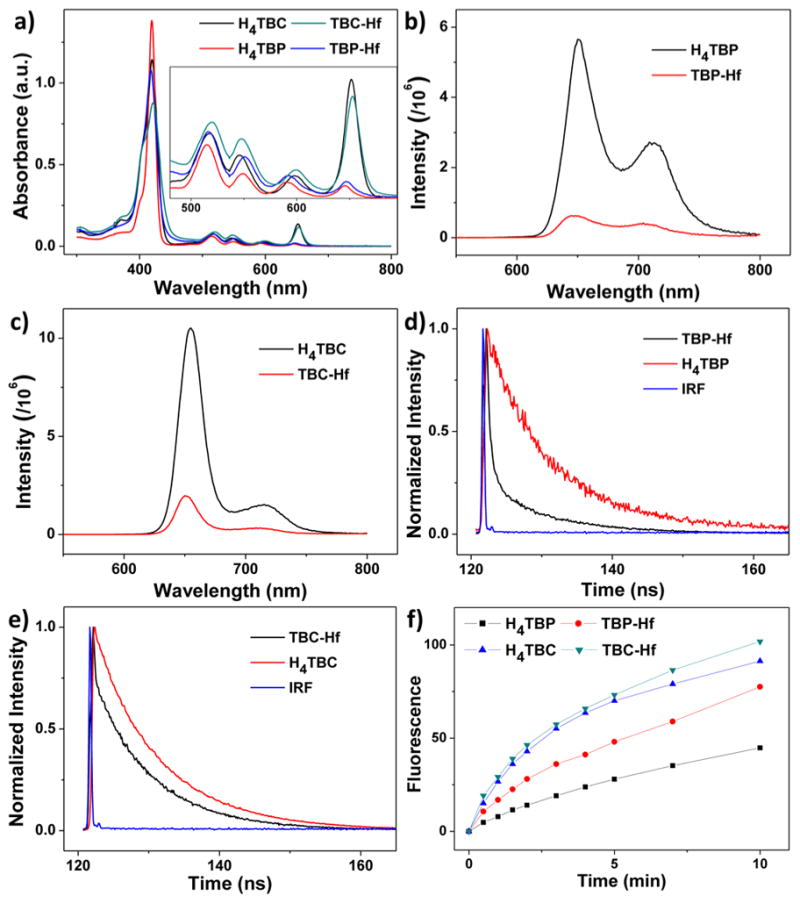
Figure 3.

Photophysics and photochemistry of the ligands and nMOFs. (a) UV–visible absorption spectra of H4TBP, H4TBC, TBP-Hf, and TBC-Hf. Inset shows expanded views of the Q-band regions. Fluorescence spectra of H4TBP and TBP-Hf (b), and H4TBC and TBC-Hf (c), with excitation at 420 nm. Time-resolved fluorescence decay traces of H4TBP and TBP-Hf (d), and H4TBC and TBC-Hf (e), along with instrument response function (IRF). (f) Singlet oxygen generation by H4TBP, H4TBC, TBP-Hf, and TBC-Hf with a 650 nm LED irradiation at 20 mW/cm2, detected by Singlet Oxygen Sensor Green assay.
