Figure 4.

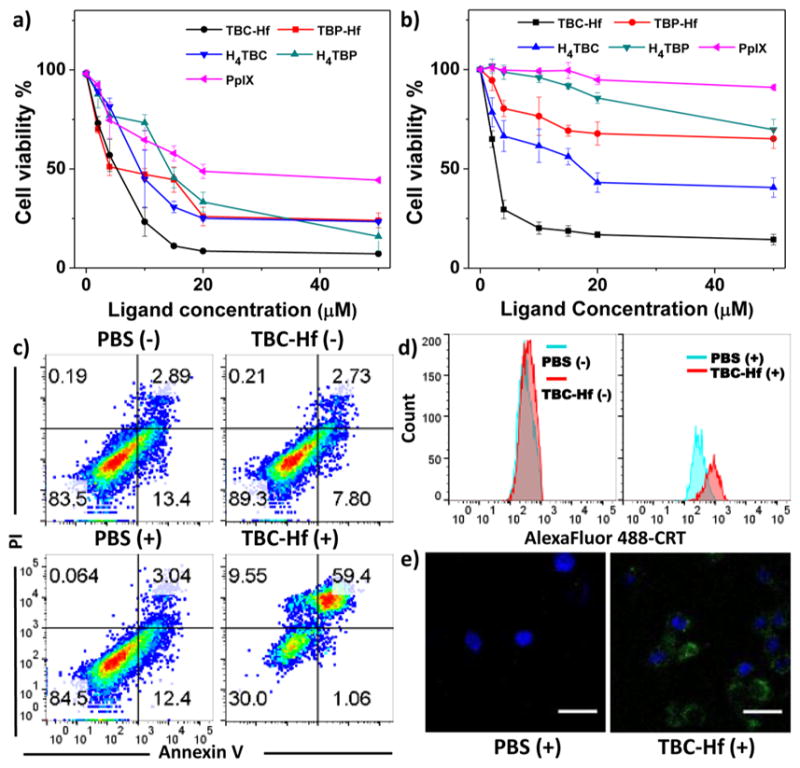
In vitro PDT efficacy and mechanistic study. PDT cytotoxicity of H4TBP, TBP-Hf, H4TBC, TBC-Hf, and PpIX at different PS concentrations in CT26 (a) and MC38 cells (b). (c) Annexin V/PI analysis of MC38 cells incubated with TBC-Hf or PBS, with or without irradiation (90 J/cm2). The quadrants from lower left to upper left (counter clockwise) represent healthy, early apoptotic, late apoptotic, and necrotic cells, respectively. The percentage of cells in each quadrant is shown on each graph. (+) and (−) refer to with and without irradiation, respectively. (d) CRT exposure on the cell surface of MC38 was assessed after incubation with PBS and TBC-Hf, with or without light irradiation (90 J/cm2), by flow cytometry analysis. The fluorescence intensity was gated on PI-negative cells. (e) Immunofluorescence microscopy of CRT expression on the cell surface of MC38 treated with PBS and TBC-Hf upon irradiation (90 J/cm2).
