
Figure 5.
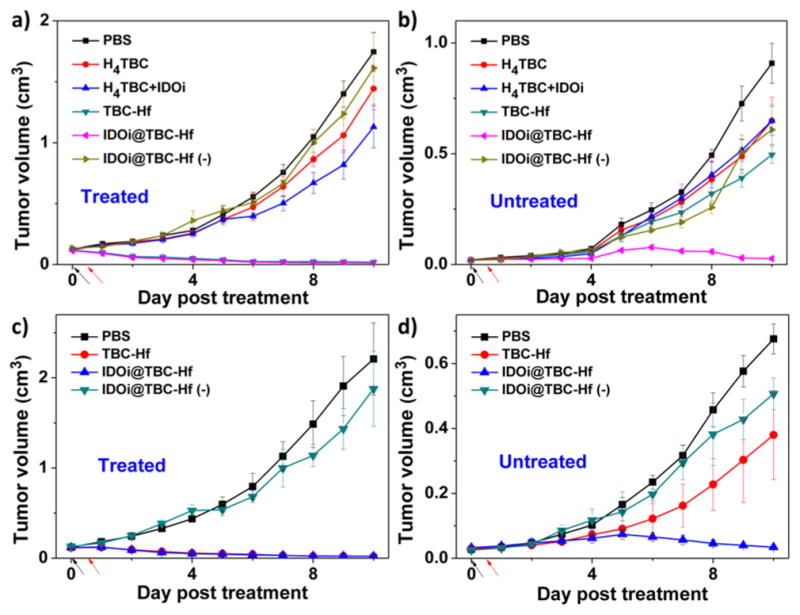
In vivo anticancer efficacy showing abscopal effect. Growth curves for treated (a,c) and untreated (b,d) tumors of CT26 (a,b) or MC38 (c,d) tumor-bearing mice after PDT treatment. Black and red arrows refer to the time of injection and irradiation, respectively.