Figure 6.
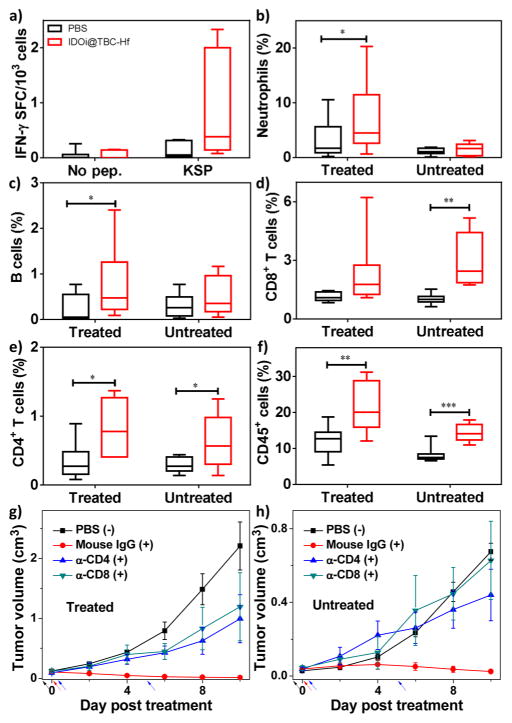
Antitumor immunity of PDT by IDOi@TBC-Hf. (a) Antigen-specific IFN-γ spot forming cells (SFC) 14 days after IDOi@ TBC-Hf PDT treatment. The percentage of tumor-infiltrating neutrophils (b) and B cells (c) with respect to the total number of cells in the tumor compared to PBS, 12h after IDOi@TBC-Hf PDT treatment. The percentage of tumor-infiltrating CD8+ T cells (d), CD4+ T cells (e), and CD45+ cells (f) with respect to the total number of cells in the tumors 12 days after IDOi@TBC-Hf PDT treatment. Growth curves for primary, treated (g) and distant, untreated (h) tumors after PDT treatment (+) with IDOi@TBC-Hf and injections of Mouse IgG, anti-CD4, or anti-CD8 antibody, compared to PBS control without PDT treatment (−). Black, red, and blue arrows refer to the time of IDOi@TBC-Hf injection, light irradiation, and antibody injection, respectively.

