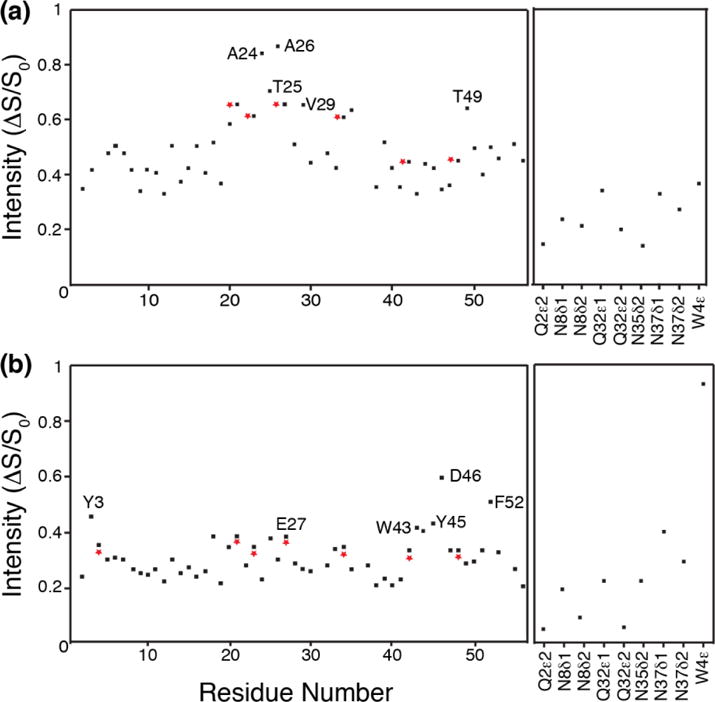
Fig. 6.

Plot of S/S0 intensity vs backbone amide (left) and sidechain (right) amino protons in uniformly labeled 2H, 13C, 15N labeled GB1 protein, back-exchanged with 30% amide protons. (a) shows the plot for 13CH3 dephasing for 600 us, and (b) shows the plot for aromatic 13C dephasing for 600 us. The residues showing maximum dephasing have been labeled. Red asterisks indicate that the corresponding residues have overlapped peaks in the 15N-1H spectrum.
