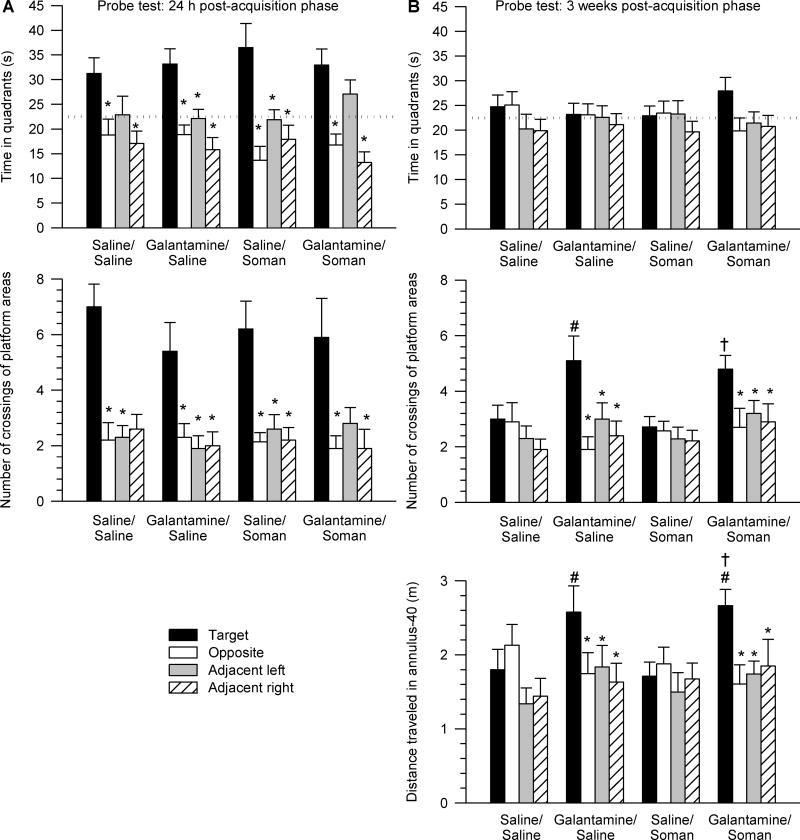
Figure 3. Peformance of guinea pigs in probe tests performed one day and three weeks after completion of the acquisition phase of the MWM training started four days following the injections of saline, soman, and/or galantamine.
Results are from the same animals as those that completed the MWM training shown in Figure 2. A. Data are from the probe test performed 24 h after completion of the acquisition phase. Top graph shows the time animals spent in each of the four quadrants of the pool. Bottom graph shows number of crossings of the platform areas virtually positioned in the center of each quadrant of the pool. Within each experimental group, animals showed bias to the target quadrant and to the platform area in the center of the training quadrant (* p < 0.05 according to one-way ANOVA followed by Dunnett post-hoc test). B. Data are from the probe test performed three weeks after completion of the acquisition phase. Top graph depicts the time spent in each quadrant of the pool. Middle graph shows the number of crossings of the platform areas virtually positioned in the center of each quadrant. Bottom graph shows the distance travelled in the pre-defined 40-cm annulus surrounding the center of each quadrant. Within each experimental group, animals showed no bias to the target quadrant. However, animals pre-treated with galantamine showed preference to crossing the platform and the annulus-40 area vitually positioned in the center of the training quadrant (* p < 0.05 according to one-way ANOVA followed by Dunnett post-hoc test). In addition, galantamine-pretreated animals showed significantly better performance than saline-pretreated expressed as a higher number of the target platform crossings and larger distance traveled in the target annulus-40 zone (# p < 0.05 vs. saline/saline, † p < 0.05 vs. saline/soman according to one-way ANOVA followed by Fisher’s LSD post-hoc test). In A and B, the training (target) area was used as the reference against which the other three areas were named as shown in Figure 1. Graph and error bars represent mean and SEM, respectively, of results obtained from 10–15 animals. The horizontal dotted lines in the top graphs represent the chance level (22.5 s).

