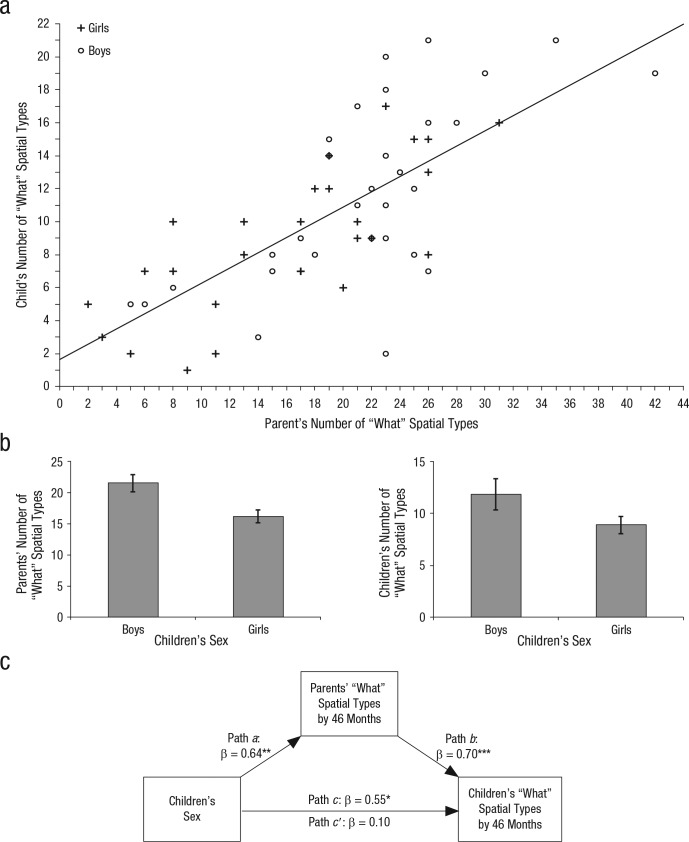
Fig. 1.
Results across the nine observation sessions. The scatterplot (with best-fitting regression line; a) shows the relation between the mean number of “what” spatial types each child and his or her parent produced, separately for boys and girls. The bar graphs (b) show the mean number of “what” spatial types produced by parents (left) and children (right), separately for boys and girls. Error bars show ±1 SEM. The model (c) illustrates the effect of children’s sex on children’s production of “what” spatial types, as mediated by parents’ production of “what” spatial types. Asterisks indicate significant paths (*p ≤ .05, **p ≤ .01, ***p ≤ .001).

