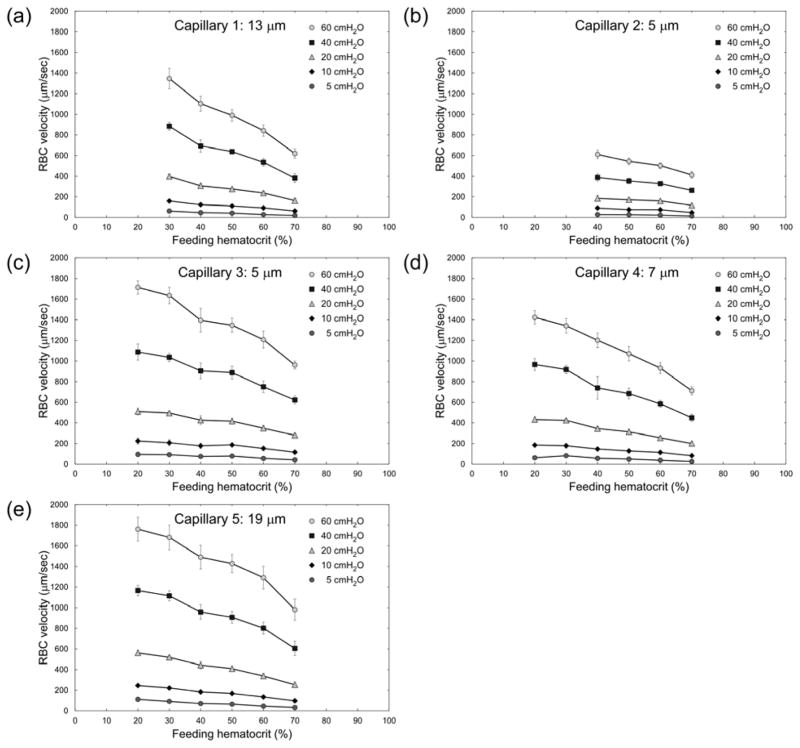
Fig. 2.
Dependence of RBC velocity (VRBC) on feeding hematocrit (Hctfeeding) for ‘capillaries’ of the artificial microvascular network, at different perfusion pressures (ΔP). Values shown are mean ± standard deviation, n = 0, 4, 6, 4, 8 and 8; 0, 0, 4, 5, 5 and 6; 5, 4, 7, 7, 4 and 7; 6, 5, 5, 7, 7 and 7; and 4, 5, 6, 7, 8 and 8 for Hctfeeding = 20, 30, 40, 50, 60 and 70% respectively in Capillaries 1, 2, 3, 4 and 5 respectively.

