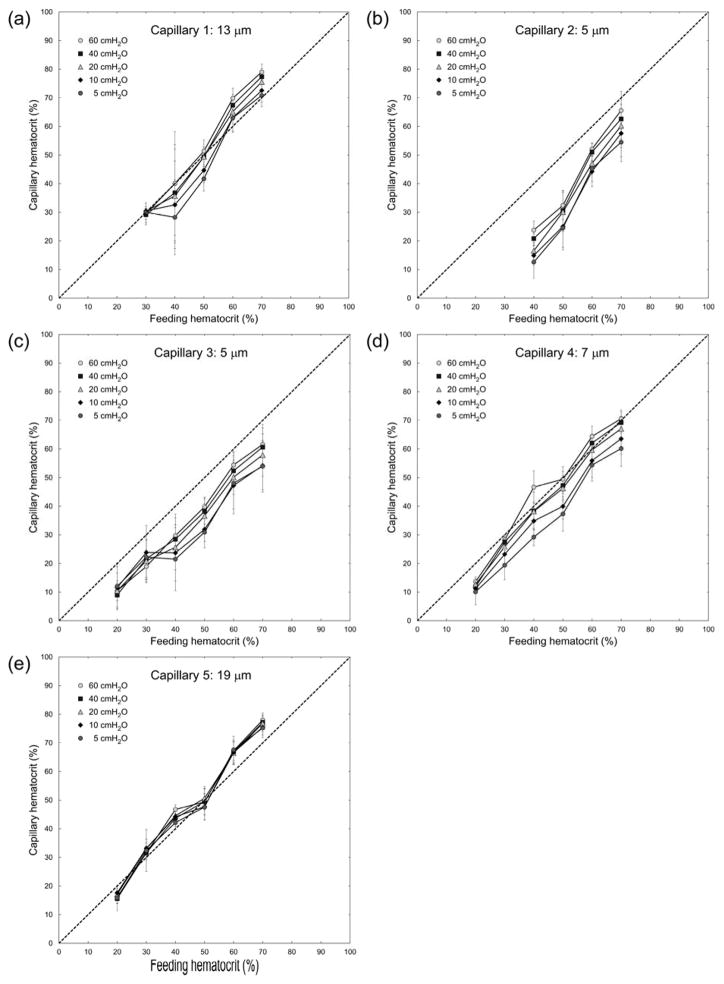
Fig. 3.
Relationship between feeding hematocrit (Hctfeeding) and capillary hematocrit (Hctcapillary) for ‘capillaries’ of the artificial microvascular network, at different perfusion pressures (ΔP). The dotted line indicates the line of identity. Values shown are mean ± standard deviation, n = 0, 4, 6, 4, 8 and 8; 0, 0, 4, 5, 5 and 6; 5, 4, 7, 7, 4 and 7; 6, 5, 5, 7, 7 and 7; and 4, 5, 6, 7, 8 and 8 for Hctfeeding = 20, 30, 40, 50, 60 and 70% respectively in Capillaries 1, 2, 3, 4 and 5 respectively.

