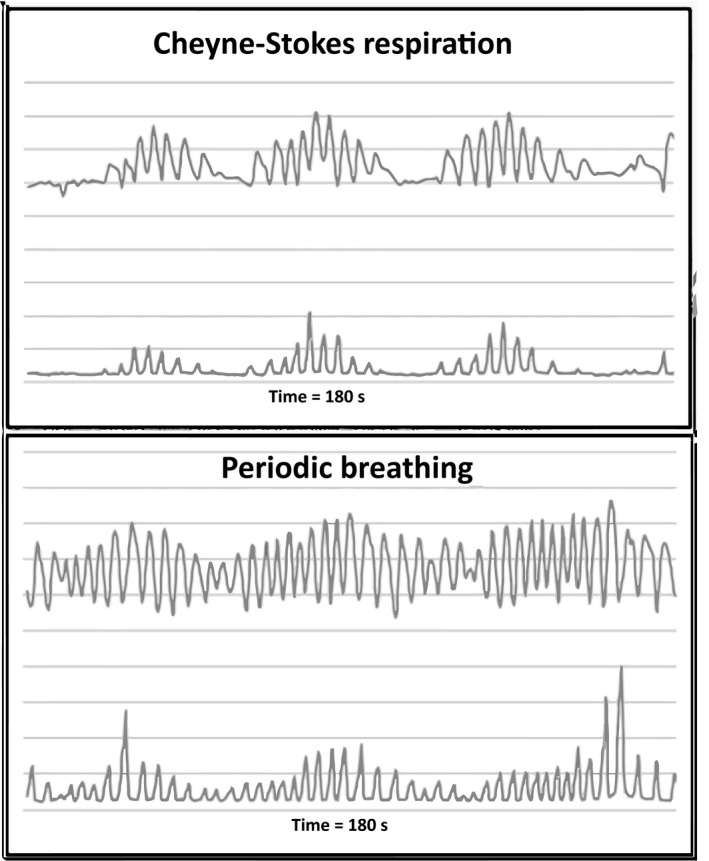
Figure 1.

Top: Cheyne‐Stokes respiration; bottom: periodic breathing over 180 s. In each figure the top line is the mean QRS amplitude in 1/4 μV and is used to measure tidal volume. The bottom line is a myogram signal with arbitrary units used to detect tidal volume. In Cheyne‐Stokes respiration apnea is seen as a flat line in both the QRS amplitude and the myogram waveforms
