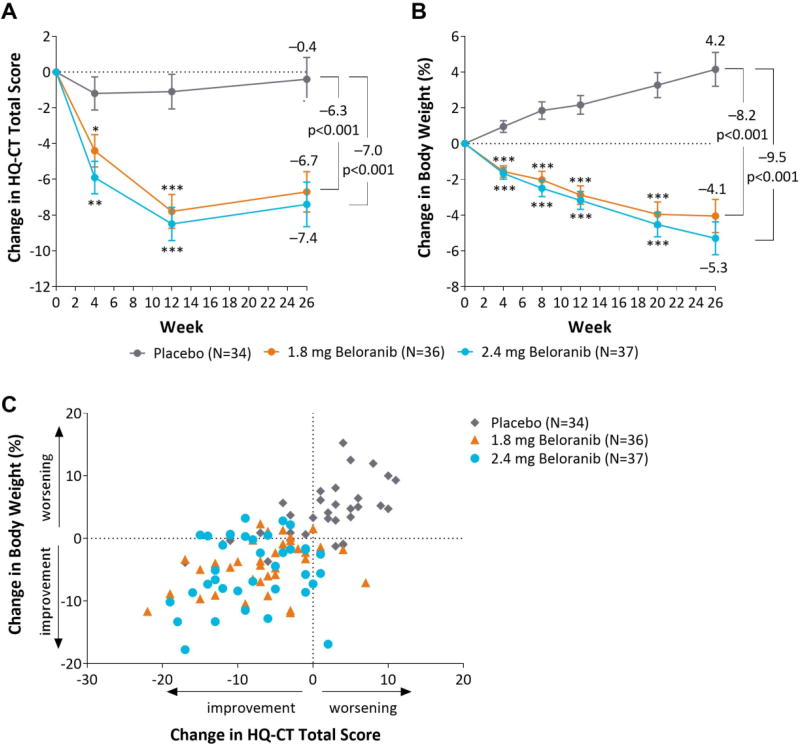
Figure 1.
Change in coprimary endpoints and scatterplot of change in weight and HQ-CT total score. Least squares mean change (SE) in HQ-CT total score (A) or least squares mean percent change in body weight (B) from baseline to Week 26 for the intent-to-treat population. Estimated treatment differences are from a mixed model repeated measures model with no imputation for missing data. *p<0.05, **p<0.01, ***p<0.001 for change from baseline for beloranib vs placebo. (C) Percent change in weight and absolute change in HQ-CT total score from baseline to Week 26 for each participant in the intent-to-treat population with missing data imputed using last-observation-carried-forward.

