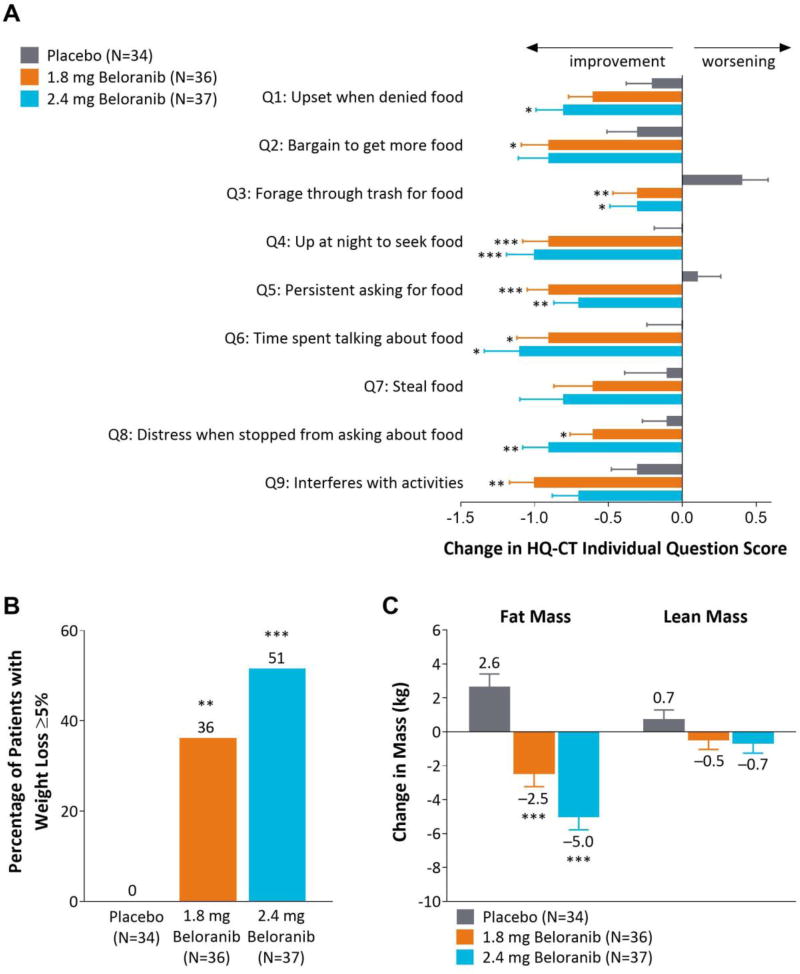
Figure 2.
Change in HQ-CT individual item scores, participants with ≥5% weight loss, and change in body mass. (A) Least squares mean change (SE) in individual question scores for the HQ-CT at Week 26. Each item had five possible responses with a score ranging from 0 to 4 (Appendix Figure 2). (B) Percentage of participants categorized as body weight responders, i.e. with at least 5% weight loss. (C) Least squares mean change (SE) in body mass from baseline to Week 26 as measured by dual-energy absorptiometry. Data are for the intent-to-treat population. *p<0.05, **p<0.01, ***p<0.001 for beloranib vs placebo.

