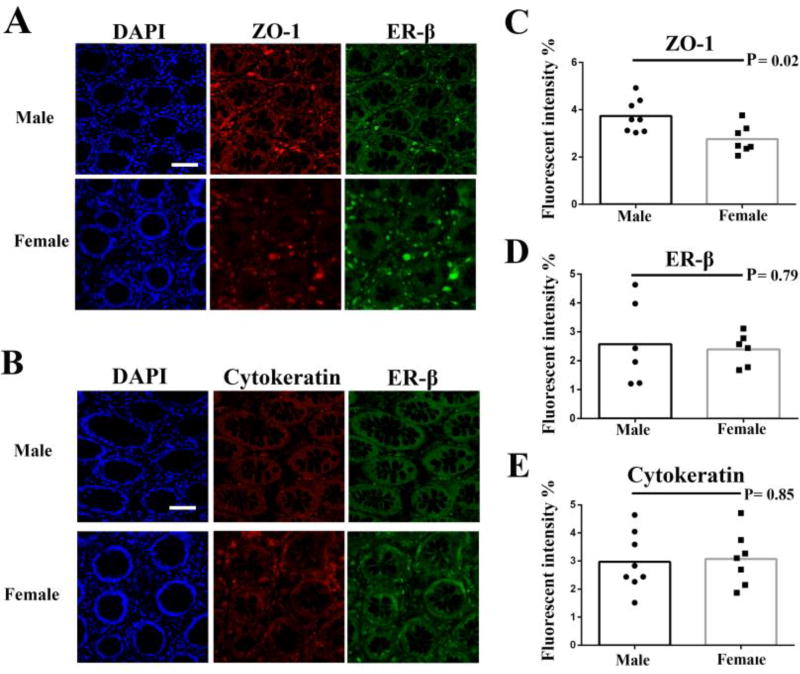
Figure 2.
Immunofluorescence analysis of the distribution of ZO-1, cytokeratin and ER-β in male and female gut tissues. The nuclei of cells were stained blue by DAPI in single section. ZO-1 and cytokeratin were detected by DyLight 594-labeled antibody. ER-β was detected by Alexa Flour 488-labeled antibodies (A and B). Bar: 100 µm. Images were then taken with a fluorescence microscopy; Fluorescence intensity of ZO-1 (C), cytokeratin (D) and ER-β (E) was analyzed using ImageJ software. P values were analyzed by Mann Whitney test (non-paired).

