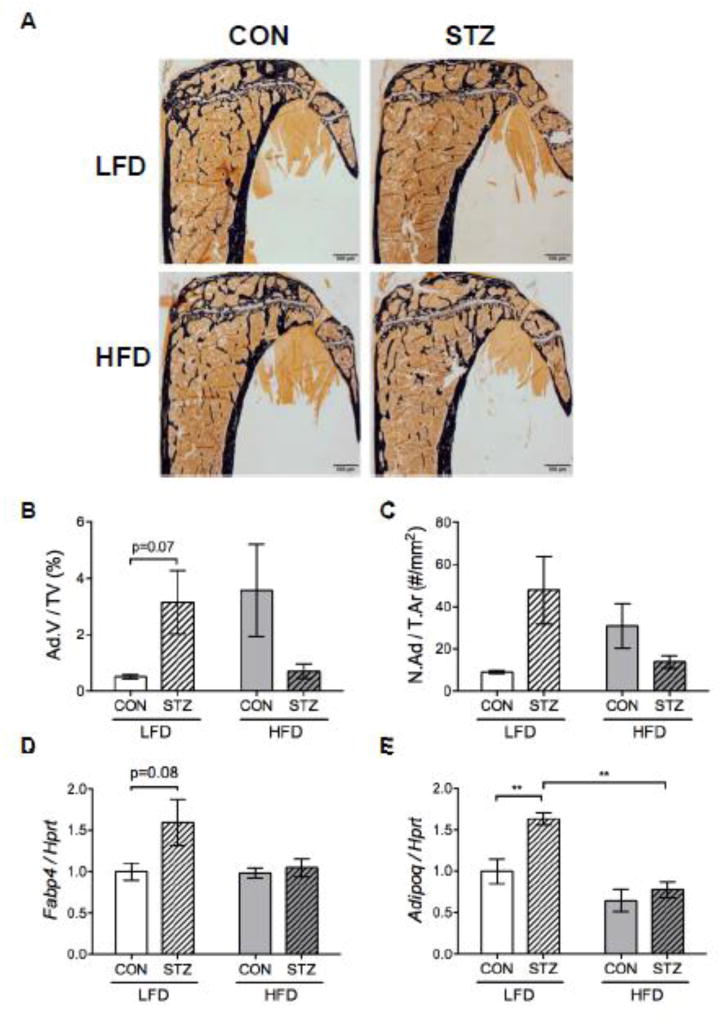
Figure 5.
Diet modulated the effect of diabetes on marrow adipocytes. Representative images from histomorphometric analysis in the proximal tibia, where black stain is mineral (Von Kossa) and adipocytes ghosts are white (A). Adipocyte volume (Ad.V/TV) (B) and number (N.Ad/T.Ar) (C) measurements from the proximal tibia (significant interaction by two-way ANOVA). Gene expression was performed in the frozen marrow tissue content flushed out from the femur at the sacrifice. Fabp4 (D) and Adipoq (E) mRNA expression were normalized to the housekeeping gene Hprt. p-value: *<0.05; **<0.01 by Holm-Sidak post hoc test after a significant 2-way ANOVA. n = 6.

